. 2012 Jan 7;279(1726):185-93.
doi: 10.1098/rspb.2011.0881. Epub 2011 Jun 1.

Phylogenetic differences of mammalian basal metabolic rate are not explained by mitochondrial basal proton leak

Affiliations

Phylogenetic differences of mammalian basal metabolic rate are not explained by mitochondrial basal proton leak

E T Polymeropoulos et al. Proc Biol Sci. .

Abstract

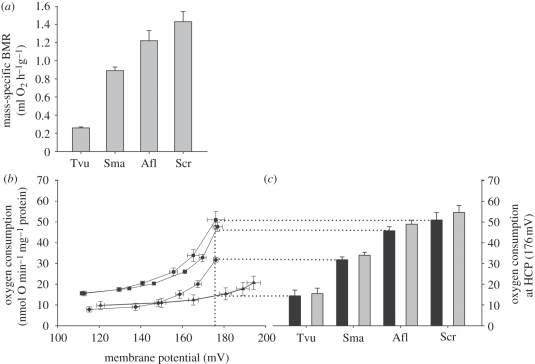
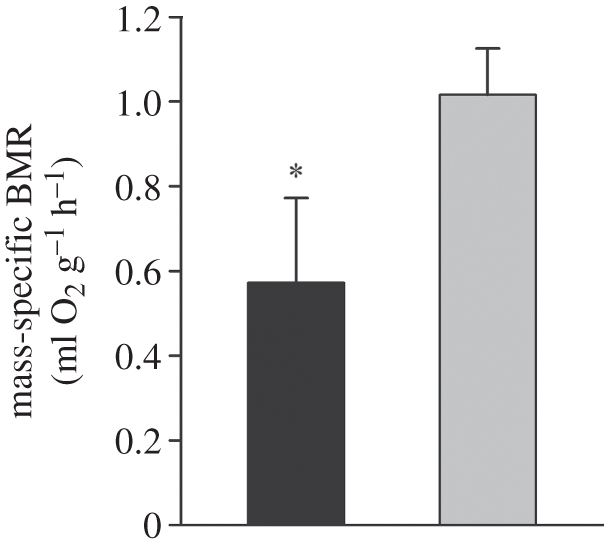
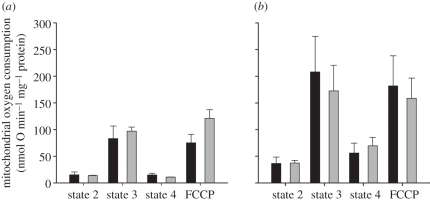
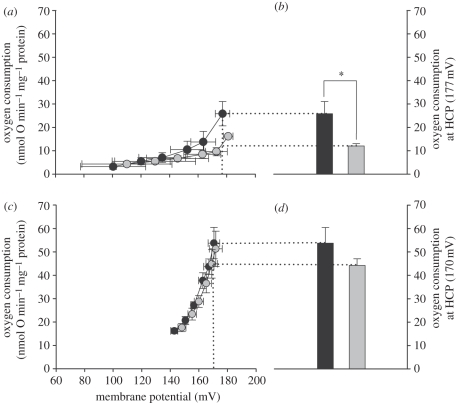
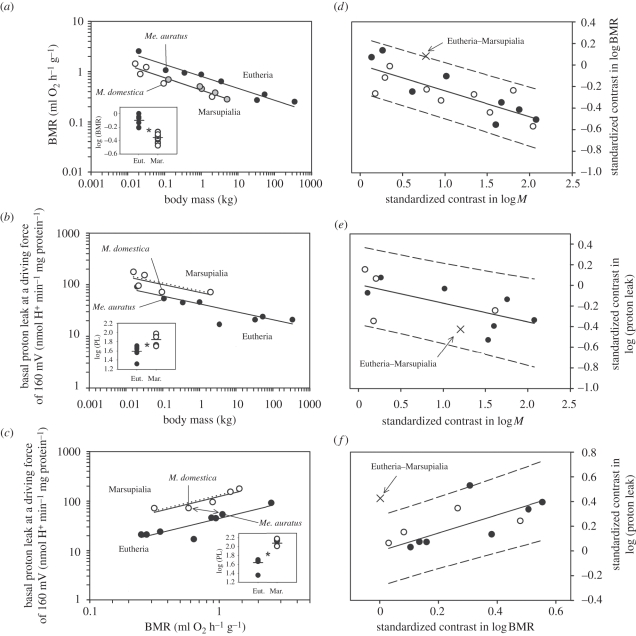
Metabolic rates of mammals presumably increased during the evolution of endothermy, but molecular and cellular mechanisms underlying basal metabolic rate (BMR) are still not understood. It has been established that mitochondrial basal proton leak contributes significantly to BMR. Comparative studies among a diversity of eutherian mammals showed that BMR correlates with body mass and proton leak. Here, we studied BMR and mitochondrial basal proton leak in liver of various marsupial species. Surprisingly, we found that the mitochondrial proton leak was greater in marsupials than in eutherians, although marsupials have lower BMRs. To verify our finding, we kept similar-sized individuals of a marsupial opossum (Monodelphis domestica) and a eutherian rodent (Mesocricetus auratus) species under identical conditions, and directly compared BMR and basal proton leak. We confirmed an approximately 40 per cent lower mass specific BMR in the opossum although its proton leak was significantly higher (approx. 60%). We demonstrate that the increase in BMR during eutherian evolution is not based on a general increase in the mitochondrial proton leak, although there is a similar allometric relationship of proton leak and BMR within mammalian groups. The difference in proton leak between endothermic groups may assist in elucidating distinct metabolic and habitat requirements that have evolved during mammalian divergence.


Figures

Figure 1.
Figure 1.
BMR and proton leak of liver mitochondria in Australian marsupials. (a) Mass-specific BMR measured at 32°C. Literature values from Song et al. [29] (S. macroura) and from Dawson & Hulbert [2] (T. vulpecula). (b) Full kinetic response of the basal proton leak rate to changes in membrane potential (filled diamond, S. macroura; filled square, S. crassicaudata; filled circle, A. flavipes; filled triangle, T. vulpecula), and (c) mitochondrial respiration rates at 35°C (black bars) and extrapolated to 37°C (grey bars) at the common membrane potential of 176 mV. Determination of the HCP is indicated by dotted lines. Afl, Antechinus flavipes; Scr, Sminthopsis crassicaudata; Sma, Sminthopsis macroura; Tvu, Trichosurus vulpecula.
Figure 2.
Figure 2.
Mass-specific BMR (ml O2 g−1 h−1) of Monodelphis domestica (black bars) and Mesocricetus auratus (grey bars) measured at thermoneutrality, 28°C and 32°C, respectively. All animals were acclimated at 24°C. Values are means ± s.e., n = 3 for both species. One-way ANOVA, *p < 0.05.
Figure 3.
Figure 3.
Mitochondrial respiration rates at state 2, 3 and state 4ol; and upon artificial uncoupling with FCCP of (a) liver and (b) skeletal muscle mitochondria of Monodelphis domestica (black) and Mesocricetus auratus (grey) measured at 32°C. No significant differences of respiration states were found between species.
Figure 4.
Figure 4.
The full kinetic response of proton leak rate to changes in membrane potential of (a) liver and (c) skeletal muscle mitochondria from Monodelphis domestica (black circles) and Mesocricetus auratus (grey circles). Mitochondrial oxygen consumption at the HCP of 177 mV for (b) liver and of 170 mV for (d) skeletal muscle mitochondria are shown in the right panel. Mitochondrial respiration in M. domestica liver mitochondria (black bars) is significantly higher than in Me. auratus (grey bars). One-way ANOVA, *p < 0.05. HCP is illustrated by dotted lines. All values are means ± s.e., n = 4 individuals, each performed in duplicate.
Figure 5.
Figure 5.
Allometric relationship between (a) BMR and body mass (M), (b) liver basal proton leak (PL) and M and (c) liver PL and BMR of marsupials (grey and white dots; white dots represent species from this study) and eutherians (black dots) measured at actual body temperatures. Dotted line shows linear regression for marsupials, when values were extrapolated to 37°C. Statistical analysis revealed that BMR as a function of M is lower in marsupials when compared with eutherians and PL in dependence of M and BMR is significantly higher in marsupials when compared with eutherians (see insets). Literature values for BMR in marsupials: Dasycercus cristicauda, Didelphis virginiana, Macropus robustus, Petaurus breviceps, Potorus tridactylus, Sarcophilus harisii [6] and eutherians: Equus caballus [30], Mus musculus [32], Mustela furo [32], Ovis aries [4], Oryctolagus cuniculus [33], Phodopus sungorus [34], Rattus norvegicus [35], Sus scrofa [36], Eut. = Eutheria, Mar. = Marsupialia. One-way ANOVA, *p < 0.05. Relationship between phylogenetically independent contrasts in (d) BMR and M, (e) PL and M and (f) PL and BMR of marsupials and eutherians, at their body temperatures. The contrast between eutherians and marsupials is indicated by X, and all relationships were calculated excluding this contrast. Solid line is the phylogenetically independent relationship constrained to pass through the origin. Dashed lines represent the 95 per cent prediction interval (PI). The difference between eutherians and marsupials is significant in (d) and (f), because the Eutheria–Metatheria contrast falls outside the 95 per cent PI for the remaining contrasts.

References

    1. Bininda-Emonds O. R. P., et al. 2008. The delayed rise of present-day mammals. Nature 456, 274.10.1038/nature07347 (doi:10.1038/nature07347) - DOI - DOI - PubMed
    1. Dawson T. J., Hulbert A. J. 1970. Standard metabolism, body temperature, and surface areas of Australian marsupials. Am. J. Physiol. 218, 1233–1238 - PubMed
    1. Frappell P. B., Butler P. J. 2004. Minimal metabolic rate, what it is, its usefulness, and its relationship to the evolution of endothermy: a brief synopsis. Physiol. Biochem. Zool. 77, 865–86810.1086/425191 (doi:10.1086/425191) - DOI - DOI - PubMed
    1. Kleiber M. 1961. Body size and metabolic rate. The fire of life (ed. Kleiber M.) pp. 177–216 New York, NY: Wiley
    1. Hemmingsen A. M. 1960. Energy metabolism as related to body size and respiratory surfaces, and its evolution. Report Stemo. Meml. Ho. 9, 1–110

Publication types

LinkOut - more resources