. 2011 Aug;21(8):1273-83.
doi: 10.1101/gr.122382.111. Epub 2011 Jun 1.

Epigenetic signatures distinguish multiple classes of enhancers with distinct cellular functions

Affiliations

Epigenetic signatures distinguish multiple classes of enhancers with distinct cellular functions

Gabriel E Zentner et al. Genome Res. 2011 Aug.

Abstract

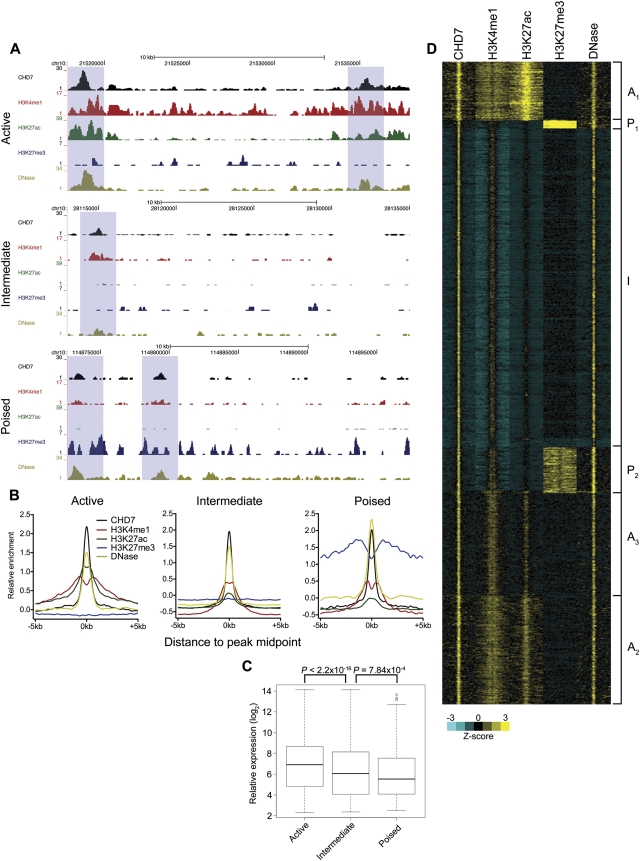
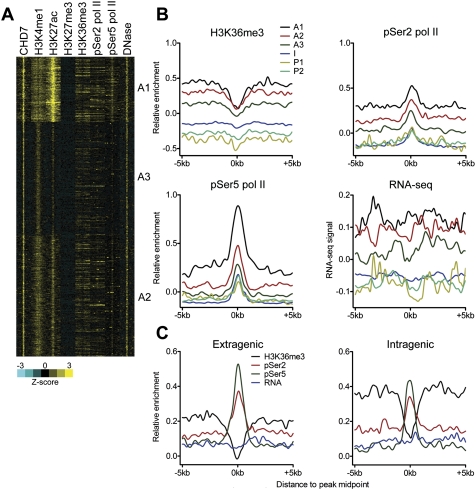
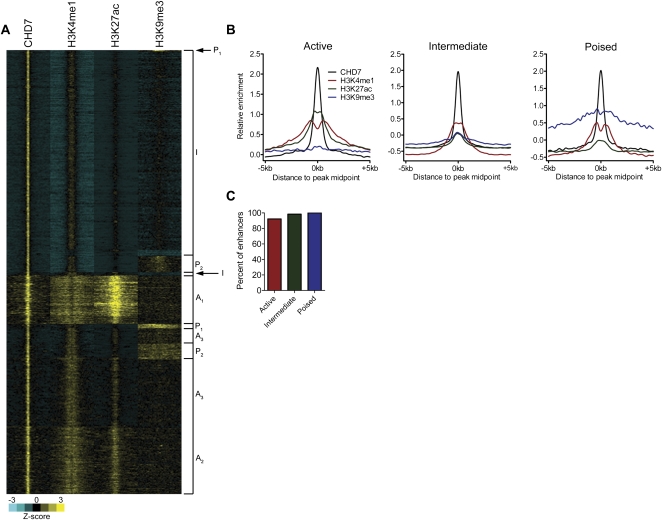
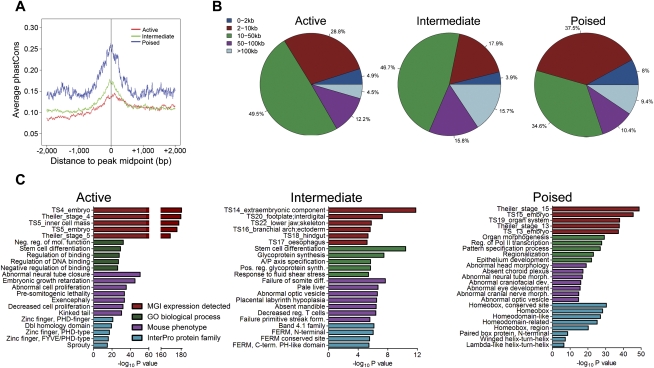
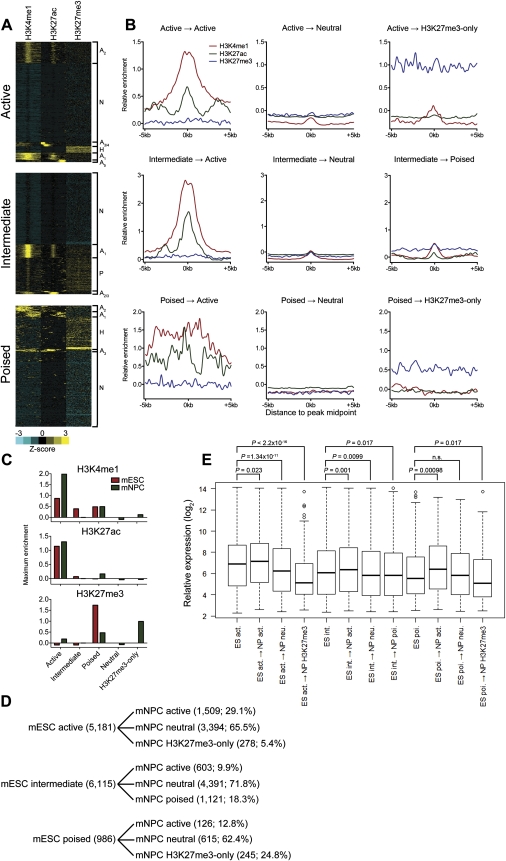
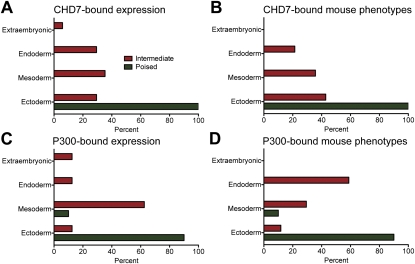
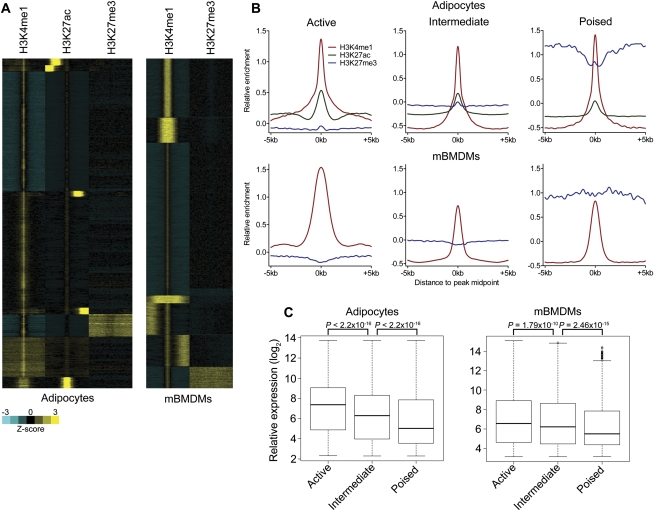
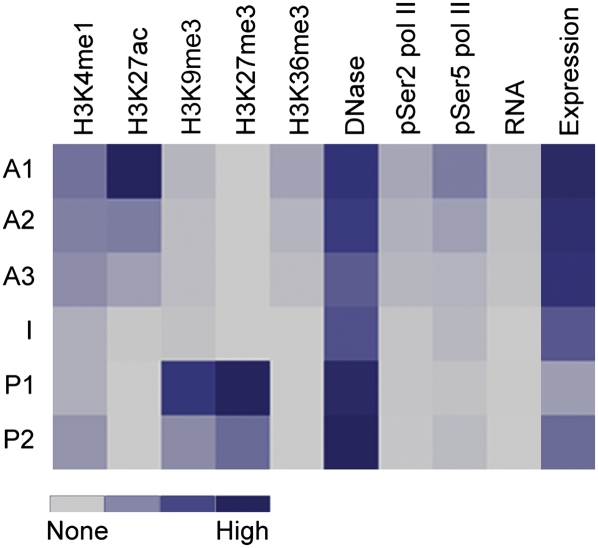
Epigenetic regulation of gene enhancer elements is important for establishing and maintaining the identity of cells. Gene enhancer elements are thought to exist in either active or poised states distinguishable by chromatin features, but a complete understanding of the regulation of enhancers is lacking. Here, by using mouse embryonic stem cells and their differentiated derivatives, as well as terminally differentiated cells, we report the coexistence of multiple, defined classes of enhancers that serve distinct cellular functions. Specifically, we found that active enhancers can be subclassified based on varying levels of H3K4me1, H3K27ac, and H3K36me3 and the pSer2/5 forms of RNA polymerase II. The abundance of these histone modifications positively correlates with the expression of associated genes and cellular functions consistent with the identity of the cell type. Poised enhancers can also be subclassified based on presence or absence of H3K27me3 and H3K9me3, conservation, genomic location, expression levels of associated genes, and predicted function of associated genes. These findings not only refine the repertoire of histone modifications at both active and poised gene enhancer elements but also raise the possibility that enhancers associated with distinct cellular functions are partitioned based on specific combinations of histone modifications.


Figures

Figure 1.
Figure 1.
Identification of multiple enhancer classes. (A) Example ChIP-seq profiles of each enhancer class in mESCs. Data were visualized using the UCSC Genome Browser. Putative active, intermediate, and poised enhancers are highlighted in blue boxes. (B) Aggregate plots of CHD7, H3K4me1, H3K27ac, H3K27me3, and DNase hypersensitivity signal centered on the CHD7 peak midpoint. (C) Boxplot of expression levels of genes associated with each enhancer class. P-values were calculated by the Wilcoxon rank-sum test. (D) Heatmap of CHD7-bound enhancers generated by k-means cluster analysis. Each window represents signal ±5 kb of the CHD7 peak midpoint. Active clusters are designated A1-3, the intermediate cluster is designated I, and the poised clusters are designated P1-2.
Figure 2.
Figure 2.
Sub-classification of active enhancers. (A) Heatmap showing levels of CHD7, histone modifications, pSer2/5 pol II, and DNase-seq signals for each active enhancer cluster. Each window represents signal ±5 kb of the CHD7 peak midpoint. (B) Aggregate plots of H3K36me3, pSer2 pol II, pSer5 pol II, and RNA-seq signal at each enhancer subclass centered on the CHD7 peak midpoint. (C) Aggregate plots showing H3K36me3, pSer2 pol II, pSer5 pol II, and RNA-seq signal at CHD7-centered active enhancers located in extragenic and intragenic regions.
Figure 3.
Figure 3.
H3K9me3 can distinguish poised from active and intermediate enhancers. (A) Heatmap of CHD7-bound enhancers showing cluster analysis with H3K9me3. Subclass designations from Figure 1D were used to classify each H3K9me3-clustered enhancer class. (B) Aggregate plots of CHD7, H3K4me1, H3K27ac, and H3K9me3 at each enhancer class following H3K9me3 clustering. (C) Percentage of enhancers in each class after H3K9me3 clustering that overlapped with enhancers in the corresponding class after H3K27me3 clustering.
Figure 4.
Figure 4.
Distinguishing features of enhancer subclasses. (A) Average phastCons plot for each enhancer class in a 4-kb window centered on the CHD7 peak midpoint. (B) Distribution of enhancers in each class relative to known transcription start sites. (C) Results of functional annotation of each enhancer class using GREAT. The −log10 of the binomial test P-value is reported.
Figure 5.
Figure 5.
Fate of mESC enhancer classes upon differentiation into neural precursor cells. (A) Heatmaps of enhancer-associated histone modifications in mNPCs defined by active (top), intermediate (middle), and poised (bottom) classes in mESCs. Each window represents ±5 kb of the CHD7 peak midpoint in mESCs. H3K9me3 was also present at poised enhancers derived from the intermediate class (data not shown). (B) Aggregate plots of enhancer-associated histone modifications for each mNPC enhancer class derived from each mESC class. (C) Bar plot of the average maximum signal for each histone modification in each mESC and mNPC enhancer class. The plot indicates that poised enhancers derived from intermediate-class enhancers contain significant levels of both H3K4me1 and H3K27me3, which is less apparent in the aggregate plot in B. (D) Summary of chromatin states achieved upon neural differentiation. The number and percentage of each enhancer state achieved are indicated. (E) Boxplot of expression levels of genes associated with each mNPC enhancer class compared to the average expression of genes in the mESC class from which they were derived. P-values were calculated by the Wilcoxon rank-sum test.
Figure 6.
Figure 6.
Expression and phenotypic analysis of enhancer-associated genes, correlated with germ layer. The spatiotemporal expression patterns of genes associated with each enhancer class in the developing mouse embryo were determined using GREAT. The germ layer origin of the tissue linked to each annotation was then determined (see Methods). Shown is the percentage of expression annotation terms corresponding to each germ layer, as well as extra-embryonic tissue, for CHD7-bound (A) and P300-bound (C) enhancers. Mouse phenotypes resulting from the mutation of genes associated with each enhancer class were also determined using GREAT. Shown is the percentage of mouse phenotypes, classified by the germ layer of origin of the affected tissue, for CHD7-bound (B) and P300-bound (D) enhancers.
Figure 7.
Figure 7.
Identification of multiple enhancer classes in terminally differentiated cells. (A) Heatmaps demonstrating the presence of active, intermediate, and poised enhancer classes in adipocytes and mBMDMs. Each window represents ±5 kb of the H3K4me1/H3K27ac peak midpoint in adipocytes or the H3K4me1 peak midpoint in mBMDMs. (B) Aggregate plots of enhancer-associated histone modifications for each adipocyte and mBMDM enhancer class. (C) Average expression of genes associated with each enhancer class in adipocytes and mBMDMs. P-values were calculated by the Wilcoxon rank-sum test.
Figure 8.
Figure 8.
Heatmap summarizing histone modifications, DNase hypersensitivity, pSer2/5 RNA pol II, RNA expression, and expression of associated genes at each enhancer subclass in mESCs.

References

    1. Barski A, Cuddapah S, Cui K, Roh T, Schones D, Wang Z, Wei G, Chepelev I, Zhao K 2007. High-resolution profiling of histone methylations in the human genome. Cell 129: 823–837 - PubMed
    1. Bilodeau S, Kagey MH, Frampton GM, Rahl PB, Young RA 2009. SetDB1 contributes to repression of genes encoding developmental regulators and maintenance of ES cell state. Genes Dev 23: 2484–2489 - PMC - PubMed
    1. Bulger M, Groudine M 2010. Enhancers: The abundance and function of regulatory sequences beyond promoters. Dev Biol 339: 250–257 - PMC - PubMed
    1. Crawford GE, Holt IE, Whittle J, Webb BD, Tai D, Davis S, Margulies EH, Chen Y, Bernat JA, Ginsburg D, et al. 2006. Genome-wide mapping of DNase hypersensitive sites using massively parallel signature sequencing (MPSS). Genome Res 16: 123–131 - PMC - PubMed
    1. Creyghton MP, Cheng AW, Welstead GG, Kooistra T, Carey BW, Steine EJ, Hanna J, Lodato MA, Frampton GM, Sharp PA, et al. 2010. Histone H3K27ac separates active from poised enhancers and predicts developmental state. Proc Natl Acad Sci 107: 21931–21936 - PMC - PubMed

Publication types

LinkOut - more resources