. 2011 Jun 1;31(22):7967-73.
doi: 10.1523/JNEUROSCI.0782-11.2011.

Long-term imaging reveals dynamic changes in the neuronal composition of the glomerular layer

Affiliations

Long-term imaging reveals dynamic changes in the neuronal composition of the glomerular layer

Yoav Adam et al. J Neurosci. .

Abstract

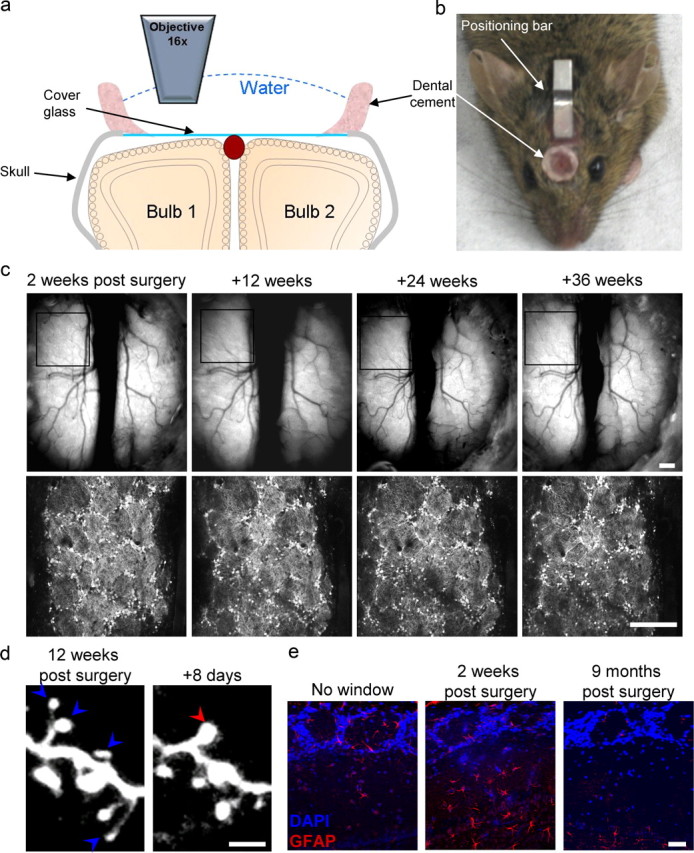
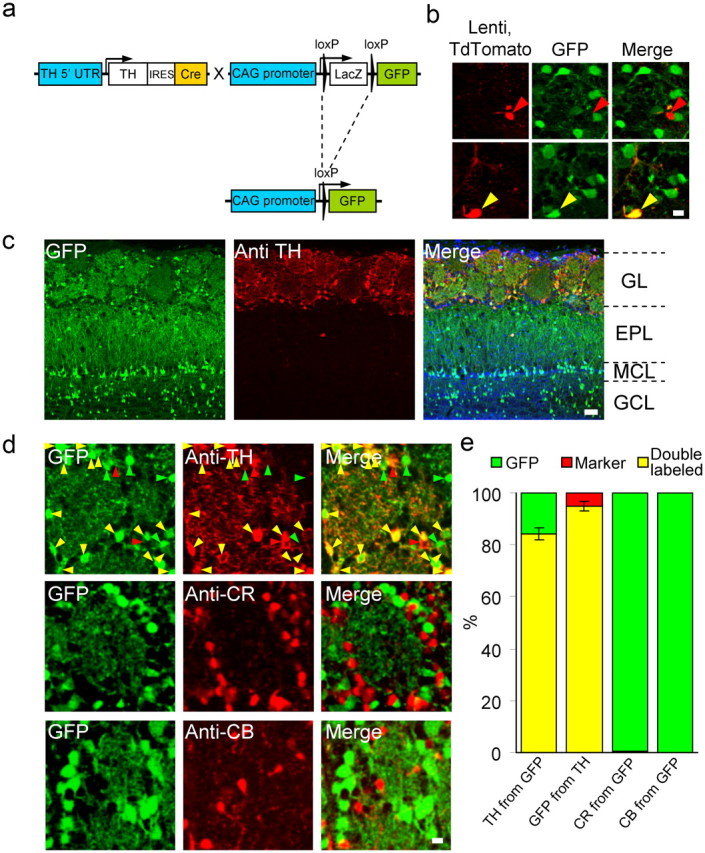
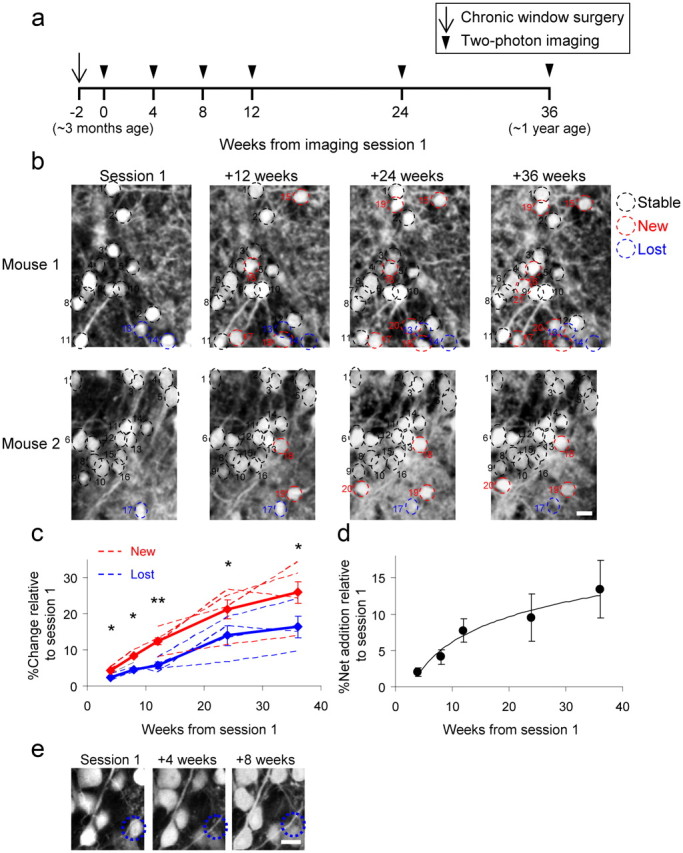
The mammalian olfactory bulb (OB) contains a rich and highly heterogeneous network of local interneurons (INs). These INs undergo continuous turnover in the adult OB in a process known as "adult neurogenesis." Although the overall magnitude of adult neurogenesis has been estimated, the detailed dynamics of the different subpopulations remains largely unknown. Here we present a novel preparation that enables long-term in vivo time-lapse imaging in the mouse OB through a chronic cranial window in a virtually unlimited number of sessions. Using this preparation, we followed the turnover of a specific neuronal population in the OB, the dopaminergic (DA) neurons, for as long as 9 months. By following the same population over long periods of time, we found clear addition and loss of DA neurons in the glomerular layer. Both cell addition and loss increased over time. The numbers of new DA cells were consistently and significantly higher than lost DA cells, suggesting a net increase in the size of this particular population with age. Over a 9 month period of adult life, the net addition of DA neurons reached ∼ 13%. Our data argue that the fine composition of the bulbar IN network changes throughout adulthood rather than simply being replenished.


Figures

Figure 1.
Figure 1.
Long-term chronic imaging in the mouse olfactory bulb. a, A schematic diagram of a coronal section of the OBs with a chronic window implant. See text for details. b, A still image of a TH::IRES-Cre × Z/EG mouse 5 months after window implantation. c, Top, Still image of the blood vessels on the surface of the OB from the first imaging session up to 36 weeks. Bottom, Low-magnification two-photon micrographs of GFP+ neurons in the glomerular layer (same region as in the boxed region on the top images). Scale bar, 200 μm. d, High-resolution two-photon micrographs of adult-born granule cell spines at 180 μm below the dura as imaged through the chronic window preparation 85 and 93 d after surgery. Red arrowhead, New spine; blue arrowhead, lost spine. Scale bar, 5 μm. e, Confocal micrographs of OB dorsal surface in coronal sections stained with an antibody against GFAP. Left, Control mouse; middle, 2 weeks after window implantation; right, 9 months after window implantation. Scale bar, 50 μm.
Figure 2.
Figure 2.
Genetic labeling of dopaminergic neurons in the mouse OB. a, Mice with Cre recombinase knocked in to the TH locus were crossed with the Z/EG GFP Cre reporter strain. In the F1 offspring, GFP is expressed in DA neurons driven by the CAG promoter. b, GFP expression in adult-born neurons. Left, TdTomato expression induced by lentivirus injection to the RMS; middle, GFP expression; right, merge. The GFP-positive cell is marked with a yellow arrowhead, and the negative cell is marked with a red arrowhead. Scale bar, 10 μm. c, GFP and TH expression in the various OB layers of TH::IRES-Cre × Z/EG mice. Left, GFP expression in a coronal section of the OB; middle, same section stained with antibodies against tyrosine hydroxylase. Right, Merged image including DAPI to stain nuclei (blue). MCL, Mitral cell layer; GCL, granule cell layer. Scale bar, 50 μm. d, High-resolution confocal micrographs of olfactory bulb coronal sections. Left, GFP expression; middle, immunostaining for TH, CR, or CB; right, merged image of red and green cell bodies. In the top images, green arrows indicate GFP-expressing cells negative for the anti-TH antibody; red arrows indicate TH-positive cells negative for GFP; yellow arrows indicate double-labeled cells. Scale bar, 10 μm. e, Quantification of single/double-labeled somata in the GL expressing GFP with or without TH, CR, and CB. TH from GFP, 84.3 ± 2.3% of GFP cells expressed TH (N = 2137 cells); GFP from TH, 95 ± 1.8% of the TH cells expressed GFP (N = 1892 cells). Pooled data from N = 9 mice 3, 6, and 13 months old (3 animals per age group); no significant difference was found among these three groups (see text). CR from GFP, 2 of 301 GFP cells expressed calretinin (N = 3 mice, 6 months old); CB from GFP, 0 of 370 GFP cells expressed calbindin (N = 3 mice, 6 months old).
Figure 3.
Figure 3.
Net increase of dopaminergic neurons with age. a, Time frame of the experiment. Imaging sessions started usually 2 weeks after window implantation and continued at the indicated intervals. Animals were ∼2.5 months old at the time of surgery, and the imaging sessions continued until the animals were ∼1 year old. b, In vivo two-photon micrographs of GFP+ somata at four time points during the experiment. Examples are projection images (composed of 3 optical planes) from two different mice imaged over a 36 week period at 12 week intervals. Stable cells are marked with a black dashed circle, newly appearing cells are marked with red, and lost cells are marked with blue. Scale bar, 10 μm. c, Quantification of the percentage of newly added (red) and lost (blue) cells. Dashed lines represent the individual animals analyzed, and bold lines represent the averages ± SEM. In all time points, the percentage of new cells was significantly higher than that of lost cells. *p < 0.05; **p < 0.01, Student's t test. d, Quantification of the net addition of DA neurons relative to the first session calculated from the data shown in c. e, High-resolution example for a lost cell body that does not reappear in two consecutive imaging sessions. A local dendrite is positioned in the volume of the lost somata. Scale bar, 10 μm.

References

    1. Adam Y, Mizrahi A. Circuit formation and maintenance–perspectives from the mammalian olfactory bulb. Curr Opin Neurobiol. 2010;20:134–140. - PubMed
    1. Bagley J, LaRocca G, Jimenez DA, Urban NN. Adult neurogenesis and specific replacement of interneuron subtypes in the mouse main olfactory bulb. BMC Neurosci. 2007;8:92. - PMC - PubMed
    1. Baker H, Morel K, Stone DM, Maruniak JA. Adult naris closure profoundly reduces tyrosine hydroxylase expression in mouse olfactory bulb. Brain Res. 1993;614:109–116. - PubMed
    1. Batista-Brito R, Close J, Machold R, Fishell G. The distinct temporal origins of olfactory bulb interneuron subtypes. J Neurosci. 2008;28:3966–3975. - PMC - PubMed
    1. Bhatt DH, Zhang S, Gan WB. Dendritic spine dynamics. Annu Rev Physiol. 2009;71:261–282. - PubMed

Publication types

LinkOut - more resources