. 2011 Jun 1;31(22):8001-12.
doi: 10.1523/JNEUROSCI.0972-11.2011.

Sparse but highly efficient Kv3 outpace BKCa channels in action potential repolarization at hippocampal mossy fiber boutons

Affiliations

Sparse but highly efficient Kv3 outpace BKCa channels in action potential repolarization at hippocampal mossy fiber boutons

Henrik Alle et al. J Neurosci. .

Abstract

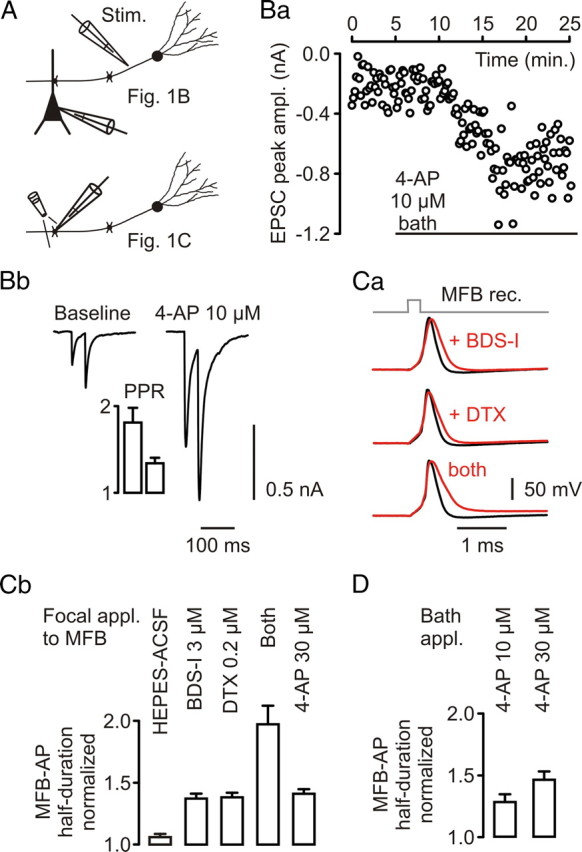
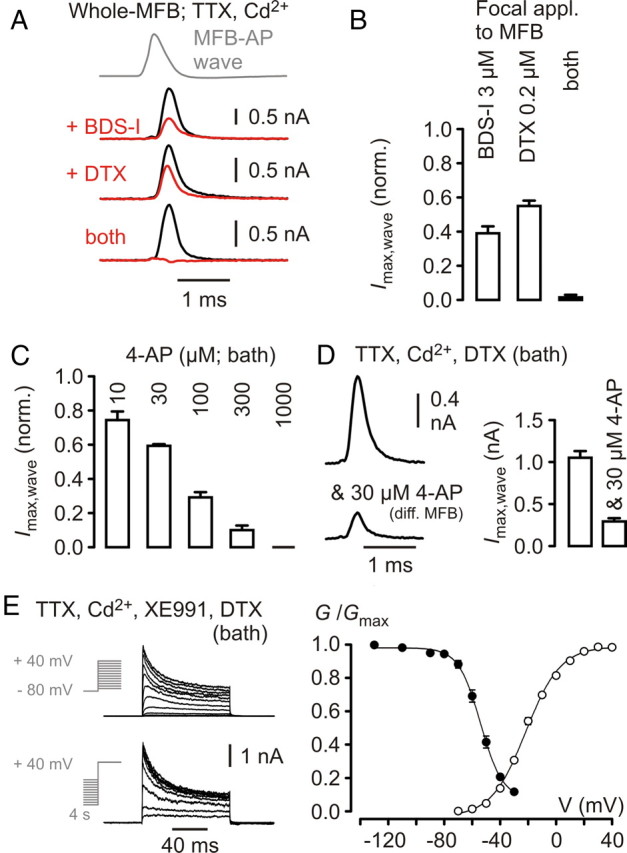
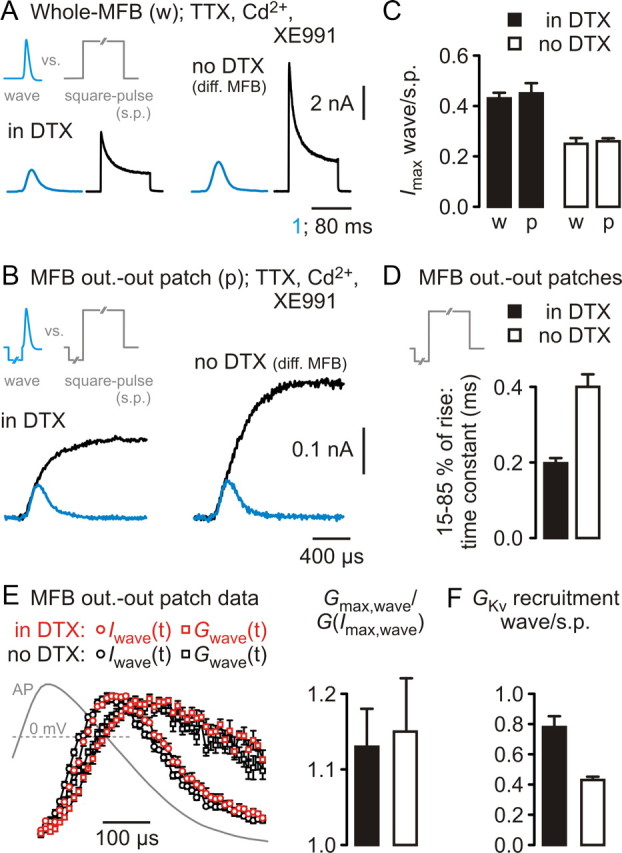
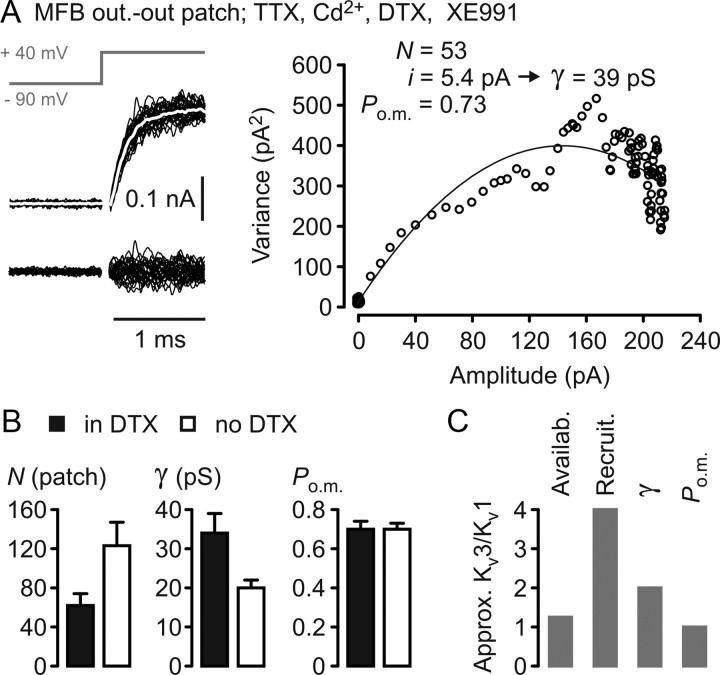
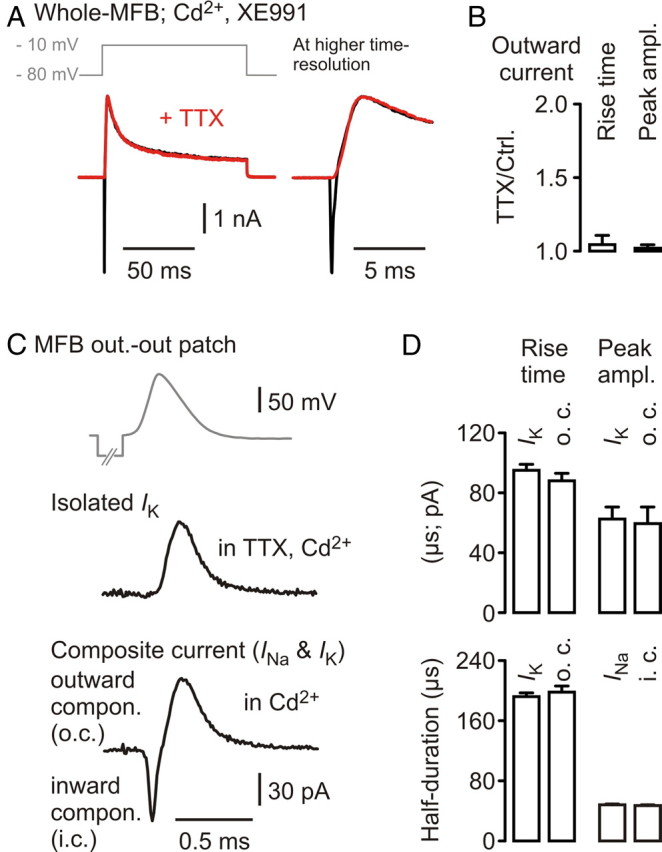
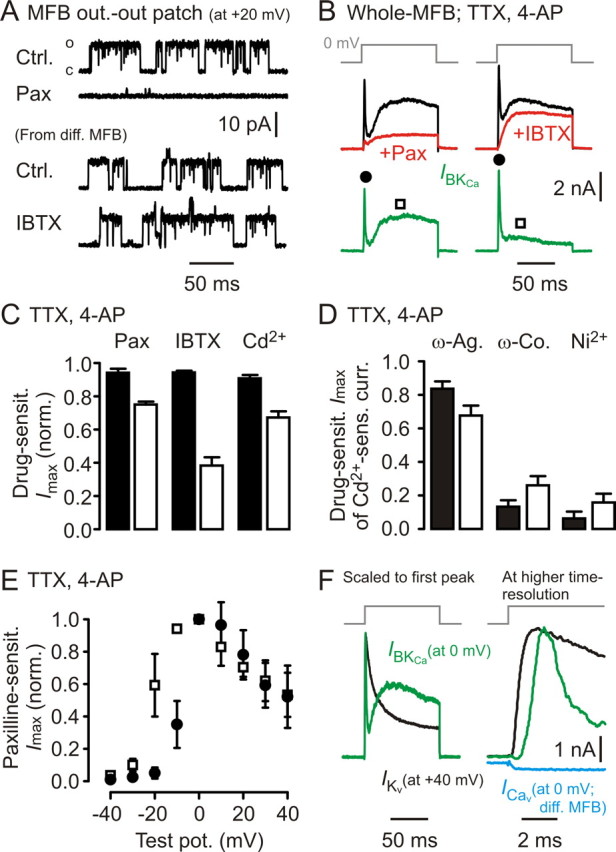
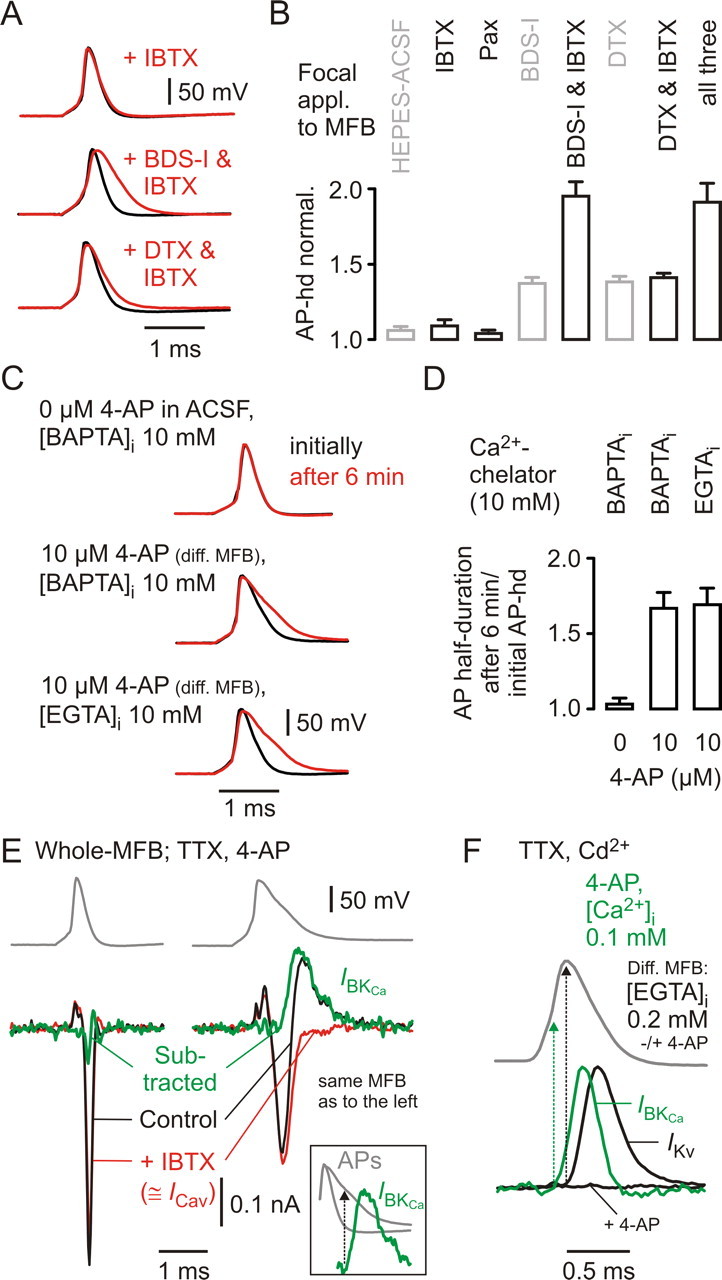
Presynaptic elements of axons, in which action potentials (APs) cause release of neurotransmitter, are sites of high densities and complex interactions of proteins. We report that the presence of K(v)3 channels in addition to K(v)1 at glutamatergic mossy fiber boutons (MFBs) in rat hippocampal slices considerably limits the number of fast, voltage-activated potassium channels necessary to achieve basal presynaptic AP repolarization. The ∼ 10-fold higher repolarization efficacy per K(v)3 channel compared with presynaptic K(v)1 results from a higher steady-state availability at rest, a better recruitment by the presynaptic AP as a result of faster activation kinetics, and a larger single-channel conductance. Large-conductance calcium- and voltage-activated potassium channels (BK(Ca)) at MFBs give rise to a fast activating/fast inactivating and a slowly activating/sustained K(+) current component during long depolarizations. However, BK(Ca) contribute to MFB-AP repolarization only after presynaptic K(v)3 have been disabled. The calcium chelators EGTA and BAPTA are equally effective in preventing BK(Ca) activation, suggesting that BK(Ca) are not organized in nanodomain complexes with presynaptic voltage-gated calcium channels. Thus, the functional properties of K(v)3 channels at MFBs are tuned to both promote brevity of presynaptic APs limiting glutamate release and at the same time keep surface protein density of potassium channels low. Presynaptic BK(Ca) channels are restricted to limit additional increases of the AP half-duration in case of K(v)3 hypofunction, because rapid membrane repolarization by K(v)3 combined with distant calcium sources prevent BK(Ca) activation during basal APs.


Figures

Figure 1.
Figure 1.
Presynaptic AP repolarization at hippocampal MFBs is performed by both Kv1 and Kv3 channels. A, Experimental configurations for experiments in B and C. Top, Extracellular stimulation (Stim.) of mossy fibers, recording from CA3 pyramidal neuron. Bottom, Recording from MFB, focal application of drug. Ba, CA3 pyramidal neuron EPSC peak amplitudes plotted over time. Bar indicates application of 10 μm 4-AP. Bb, Respective averaged current traces taken from baseline and versus end of drug application. Bar graph, Change in paired-pulse ratio (PPR) for this experiment. Left bar, Baseline; right bar, during drug application. Ca, Focal application of BDS-I (3 μm), DTX (0.2 μm), and both drugs simultaneously to different MFBs while recording APs generated by local current injection (baseline, black traces; during drug application, red traces). Cb, Collected data for changes of MFB–AP half-duration during focal application of the carrier solution alone (HEPES-buffered ACSF; n = 5), BDS-I (n = 4), DTX (n = 4), both drugs simultaneously (n = 3), and 4-AP (30 μm; n = 4). D, Changes in MFB–AP half-duration after bath application of 4-AP (10 and 30 μm; each n = 4).
Figure 2.
Figure 2.
Kv3 channel-mediated currents dominate during the MFB–AP waveform. A, Top, MFB–AP voltage waveform applied to MFBs. Second to last line of traces, K+ currents before (black) and during (red) application of drugs as indicated. Concentrations used as in Figure 1C. B, Collected data for the AP-wave-evoked K+ current peak amplitude during drug application normalized to baseline (each n = 4). C, Collected data for the AP-wave-evoked K+ current peak amplitude during bath application of 4-AP at concentrations as indicated above the bars, normalized to baseline (n = 3–12). D, Left, Top, Representative average trace of AP-wave-evoked K+ currents in the presence of DTX (bath; 0.2 μm); left, bottom, different MFB recording in the presence of DTX and 30 μm 4-AP (bath). Right, Summary of peak current amplitudes in the two conditions (different sets of experiments; n = 16 and 9). E, Left, K+ currents in DTX (bath; 0.2 μm) in response to the voltage step protocols indicated. Right, Relative K+ conductance as function of test potential (open circles; n = 9) and of conditioning prepulse potential (filled circles; n = 5) in DTX.
Figure 3.
Figure 3.
Kv3 are better recruited during MFB–AP waves than Kv1. A, Top, MFB–AP-wave command and square-pulse command applied in the whole-MFB configuration (w). Bottom, Left, K+ current traces from recordings in DTX; right, K+ current traces from recordings without DTX. Responses to the MFB–AP wave on the respective left side of the two drug conditions (blue traces). The 1 ms timescale applies to MFB–AP wave experiments and 80 ms timescale to square-pulse experiments. B, Top, MFB–AP-wave command and square-pulse command applied to outside-out patches (p) from MFBs. Bottom, Left, K+ current traces from recordings in DTX; right, K+ current traces from recordings without DTX. Responses to the MFB–AP wave (blue traces) were overlaid on the responses to the square pulse and aligned to the rising phase. C, Collected data from experiments as in A and B, displaying the ratio of peak current amplitudes obtained in response to the MFB–AP wave and to the square pulse (p, outside-out patch; w, whole-MFB). D, Time constants of a simple exponential function fitted to the rising phase (15–85% of peak amplitude) of current responses to the square pulse as in B from five (in DTX) and four (without DTX) experiments. E, Left, Time course of MFB–AP-wave-evoked K+ currents [Iwave(t), circles] and derived K+ conductances [Gwave(t), squares] from experiments in DTX (red symbols; n = 5) and without DTX (black symbols; n = 8), using the outside-out patch configuration. AP superimposed. Right, Ratio of the maximal K+ conductance during the MFB–AP (Gmax,wave) and the conductance at the peak of the K+ current [G(Imax,wave)] during the MFB–AP. Filled bar, Experiments in DTX; open bar, experiments without DTX. F, Fractions of conductances at resting membrane potential that become activated during an MFB–AP. s.p., Square pulse; filled bar, experiments in DTX; open bar, experiments without DTX.
Figure 4.
Figure 4.
Kv3 exhibit a higher single-channel conductance than Kv1 at MFBs. A, Left, Top, Square-pulse protocol to elicit K+ currents in MFB outside-out patches. Middle, Superimposed individual current responses. Average current trace superimposed in white. Small residual capacitance compensation artifacts were blanked. Left, Bottom, Traces obtained by subtracting the average trace from the individual traces. Right, Nonstationary fluctuation analysis performed on K+ currents displayed on the left. N, Number of channels per patch; i, single-channel current; γ, single-channel conductance; Po.m., maximal open probability. Continuous line indicates parabolic fit to data points. B, Collected data for parameters obtained from nonstationary fluctuation analysis (filled bars, experiments in DTX, n = 12; open bars, experiments without DTX, n = 9). C, Approximate ratios of steady-state availability at resting membrane potential, recruitment by the MFB–AP, single-channel conductance γ, and maximal open probability Po.m. for Kv3 and Kv1 channels at MFBs.
Figure 5.
Figure 5.
Absence of Na+-activated K+ channel-mediated currents at MFBs. A, Top, Voltage protocol applied to an MFB. Bottom, Current traces before (black) and after (red) wash-in of 1 μm TTX. Right, Same traces at higher temporal resolution. B, Collected data for current rise time and peak amplitude of four experiments of the kind in A, normalized to baseline. C, Top, MFB–AP wave applied to outside-out patches of MFBs. Middle, Averaged compound Kv current, isolated in TTX and Cd2+. Bottom, Composite current consisting of an inwardly directed Na+ and an outwardly directed K+ current component. Different MFB. D, Collected data of each eight recordings of isolated and composite currents as in C displaying rise times, peak current amplitudes, and half-durations.
Figure 6.
Figure 6.
Two populations of presynaptic BKCa channels can be distinguished electrophysiologically at MFBs. A, Outside-out patches drawn from MFBs (steady state at +20 mV) exhibit large single-channel openings that are sensitive to Pax but not to IBTX. Ctrl, Control. B, Long depolarizing voltage steps to 0 mV in the whole-cell recording configuration reveal Pax- and IBTX-sensitive BKCa channel-mediated currents (green) composed of two kinetically distinct components. C, Summary of Pax (n = 4), IBTX (n = 7), and cadmium (Cd2+, n = 7) sensitivity for recordings as shown in B (filled bars, first, fast activating/fast inactivating component; open bars, second, slowly activating/persistent component; see also filled dots and open squares in B). D, ω-Agatoxin, ω-conotoxin, and Ni2+ sensitivity (each n = 6) of currents as recorded in B (bar code as in C). E, Voltage dependence of first, fast activating/fast inactivating component (open squares), and of second, slowly activating/persistent component (filled circles; n = 3). F, Left, Comparison of example Kv-mediated current kinetics (black trace) and BKCa-mediated current kinetics (green trace: Cd2+-sensitive current); traces scaled to the same peak amplitude. Note the extremely fast inactivation of IBKCa. Right, Same traces at higher temporal resolution. Blue trace represents example Cav-mediated current recorded in a separate MFB. Vertical scale bar applies to BKCa- and Cav-mediated currents.
Figure 7.
Figure 7.
BKCa channels do not activate during basal MFB–APs, and their calcium source is remote. A, Focal application of IBTX (1 μm), BDS-I (3 μm) + IBTX, or DTX (0.2 μm) + IBTX to different (diff.) MFBs while recording APs generated by local current injection. Black traces, Baseline; red traces, during drug application. B, Collected data for changes of MFB–AP half-durations (AP-hd) during focal application of IBTX (n = 4), Pax (n = 4), BDS-I + IBTX (n = 3), DTX + IBTX (n = 4), and all three drugs simultaneously (n = 3) (in black), including data from Figure 1C (in gray) for comparison. C, Recordings of locally elicited MFB–APs in ACSF (top) or in ACSF containing 10 μm 4-AP (middle and bottom) with 10 mm BAPTA (top and middle) or 10 mm EGTA (bottom) in the intracellular solution. Black traces represent APs recorded immediately after establishing the whole-cell configuration; red traces represent APs recorded after 6 min in the whole-cell configuration. D, Changes in MFB–AP half-durations after 6 min recording time relative to those determined initially for experiments in ACSF and 10 mm BAPTA (left; n = 3), in ACSF containing 10 μm 4-AP and intracellularly 10 mm BAPTA (middle; n = 4) or 10 mm EGTA (right; n = 4). E, Top traces, MFB–AP-wave commands with different half-durations (left, basal MFB–AP; right, AP-hd, ∼700 μs), applied in TTX (1 μm), 4-AP (1 mm), and with 0.2 mm EGTA in the intracellular recording solution. Both waveforms were applied to an individual MFB. Bottom, Corresponding current traces in control and after focal application of IBTX (1 μm; red traces). Subtracted traces (control-IBTX) shown in green (IBKCa, BKCa-mediated current). ICav, Voltage-gated calcium channel-mediated current. Inset shows overlay of both AP waveforms and the BKCa-mediated current in response to the broad AP. Arrow indicates membrane potential of broad AP, at which IBKCa sets on. F, Top, Wave command of basal MFB–AP. Bottom, BKCa-mediated current (IBKCa, green) recorded in the presence of TTX, Cd2+, and 1 mm 4-AP, using an intracellular solution containing 0.1 mm free Ca2+. Black traces represent recordings from a different MFB in TTX and Cd2+ using an intracellular solution containing 0.2 mm EGTA, before (IKv, Kv-mediated current) and after bath application of 1 mm 4-AP. Arrows indicate respective membrane potentials, at which currents set on.

References

    1. Alle H, Geiger JR. Combined analog and action potential coding in hippocampal mossy fibers. Science. 2006;311:1290–1293. - PubMed
    1. Alle H, Roth A, Geiger JR. Energy-efficient action potentials in hippocampal mossy fibers. Science. 2009;325:1405–1408. - PubMed
    1. Augustine GJ. Regulation of transmitter release at the squid giant synapse by presynaptic delayed rectifier potassium current. J Physiol. 1990;431:343–364. - PMC - PubMed
    1. Augustine GJ, Santamaria F, Tanaka K. Local calcium signaling in neurons. Neuron. 2003;40:331–346. - PubMed
    1. Baranauskas G, Tkatch T, Nagata K, Yeh JZ, Surmeier DJ. Kv3.4 subunits enhance the repolarizing efficiency of Kv3.1 channels in fast-spiking neurons. Nat Neurosci. 2003;6:258–266. - PubMed

Publication types

MeSH terms

Substances

LinkOut - more resources