. 2011 Jun 1;31(22):8306-19.
doi: 10.1523/JNEUROSCI.0567-11.2011.

Deletion of astroglial Dicer causes non-cell-autonomous neuronal dysfunction and degeneration

Affiliations

Deletion of astroglial Dicer causes non-cell-autonomous neuronal dysfunction and degeneration

Jifang Tao et al. J Neurosci. .

Abstract

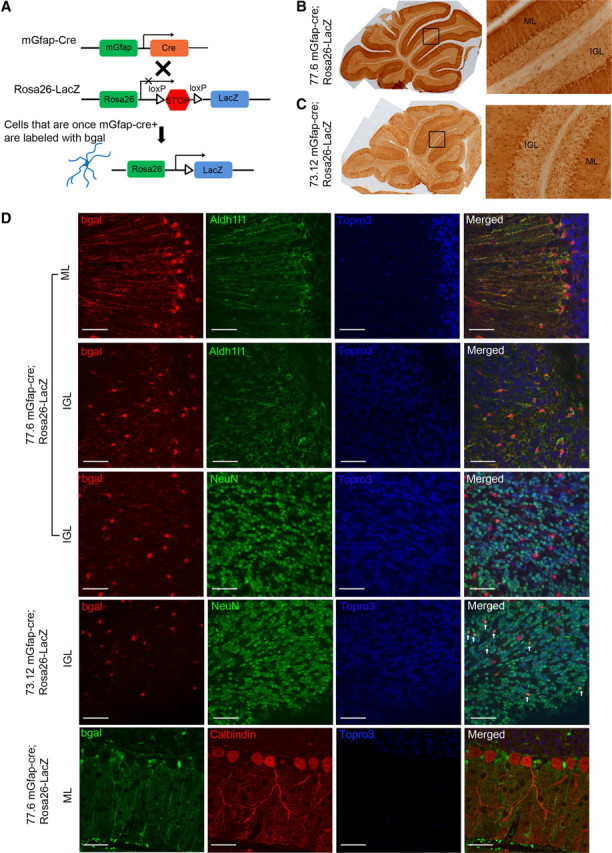
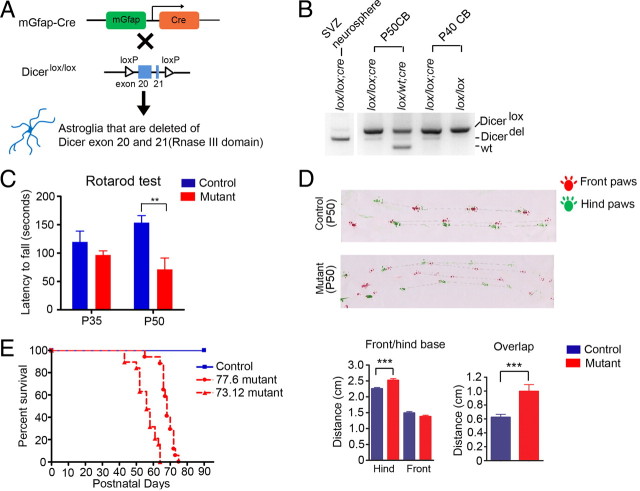
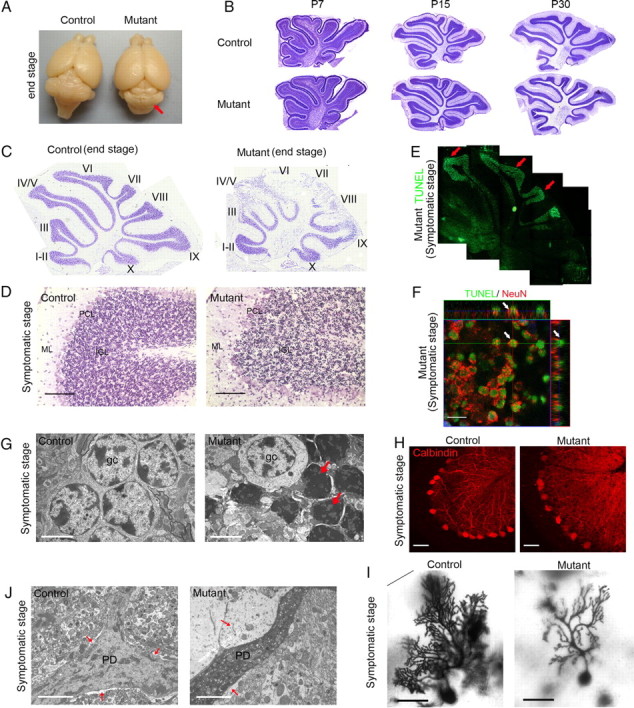
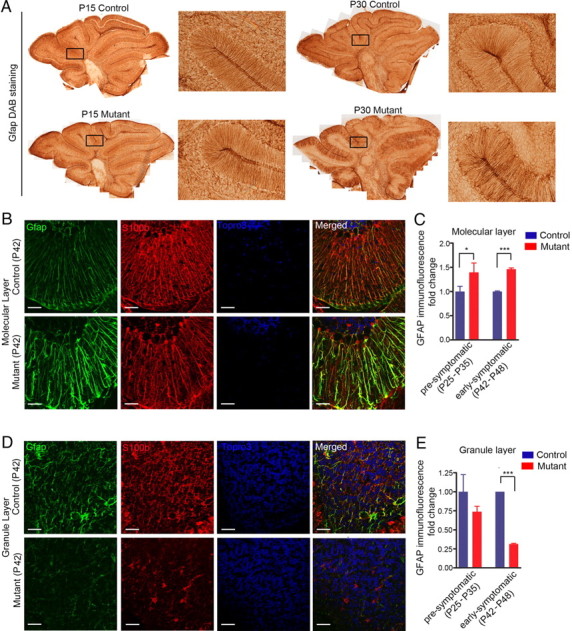
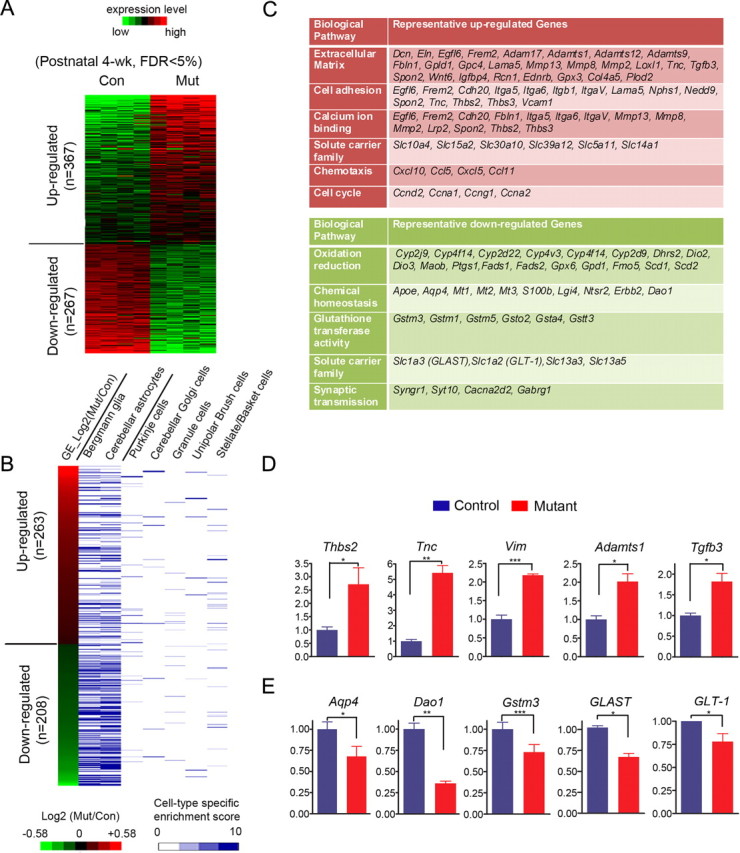
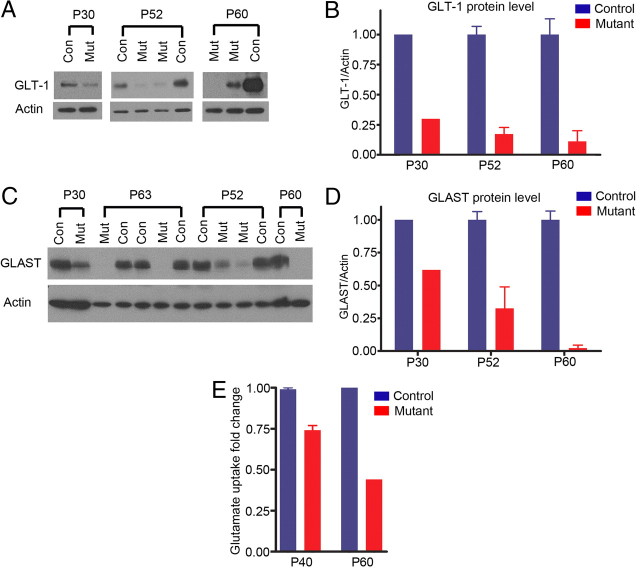
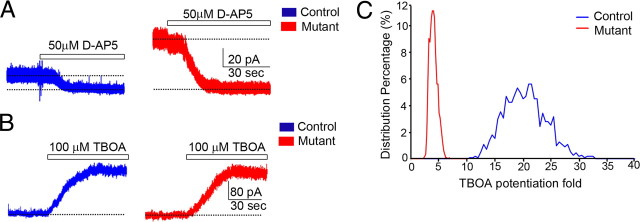
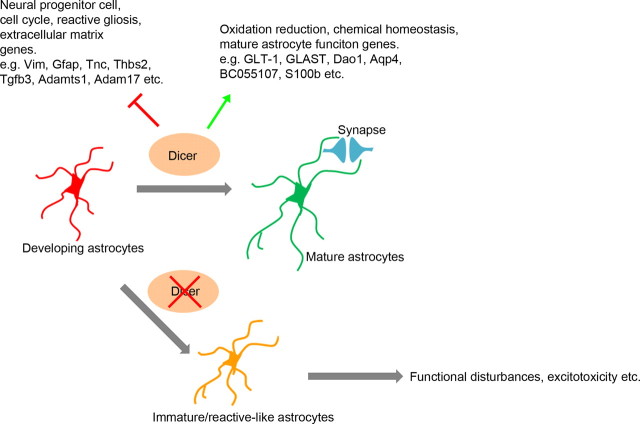
The endoribonuclease, Dicer, is indispensable for generating the majority of mature microRNAs (miRNAs), which are posttranscriptional regulators of gene expression involved in a wide range of developmental and pathological processes in the mammalian CNS. Although functions of Dicer-dependent miRNA pathways in neurons and oligodendrocytes have been extensively investigated, little is known about the role of Dicer in astrocytes. Here, we report the effect of Cre-loxP-mediated conditional deletion of Dicer selectively from postnatal astroglia on brain development. Dicer-deficient mice exhibited normal motor development and neurological morphology before postnatal week 5. Thereafter, mutant mice invariably developed a rapidly fulminant neurological decline characterized by ataxia, severe progressive cerebellar degeneration, seizures, uncontrollable movements, and premature death by postnatal week 9-10. Integrated transcription profiling, histological, and functional analyses of cerebella showed that deletion of Dicer in cerebellar astrocytes altered the transcriptome of astrocytes to be more similar to an immature or reactive-like state before the onset of neurological symptoms or morphological changes. As a result, critical and mature astrocytic functions including glutamate uptake and antioxidant pathways were substantially impaired, leading to massive apoptosis of cerebellar granule cells and degeneration of Purkinje cells. Collectively, our study demonstrates the critical involvement of Dicer in normal astrocyte maturation and maintenance. Our findings also reveal non-cell-autonomous roles of astrocytic Dicer-dependent pathways in regulating proper neuronal functions and implicate that loss of or dysregulation of astrocytic Dicer-dependent pathways may be involved in neurodegeneration and other neurological disorders.


Figures

Figure 1.
Figure 1.
In cerebella, mGfap-cre transgenic lines mainly target postnatal astroglial cells. A, A schematic of lineage tracing using mGfap-cre transgenic mice crossing with Rosa26-LacZ reporter line. B, C, Bright-field immunohistochemistry DAB stainings of the reporter protein β-gal in P35 mGfap-cre; Rosa26-LacZ mice cerebella showed that Bergmann glia and IGL astrocytes were positively labeled (B for line 77.6 and C for line 73.12). ML, Molecular layer. D, Representative confocal images of colabeling of reporter protein β-gal and astroglial marker Aldh1L1, neuronal marker NeuN, or Purkinje cell marker Calbindin in cerebellum. Scale bars, 50 μm. β-gal colocalized well with Aldh1L1 and there was no colocalization of β-gal and Calbindin. There was no colocalization of β-gal and NeuN in line 77.6. The ratio of β-gal+NeuN+/NeuN+ in line 73.12 was calculated to be ∼1–5% from multiple confocal pictures. The white arrows indicate colocalization of β-gal and NeuN in line 73.12.
Figure 2.
Figure 2.
Dicerflox/flox; mGfap-cre mutant mice developed ataxia. A, A schematic of crossing mGfap-cre transgenic mice with Dicer lox/lox line. B, Genomic DNA PCR showed the ratio of Dicerflox allele (390 bp), Dicerdel allele (309 bp), and wild-type allele (259 bp). DNA samples were extracted either from whole cerebella or in vitro cultured neurospheres derived from SVZ neural progenitor cells. C, Rotarod tests at postnatal day 35 showed a slightly weaker performance of mutant mice compared to control mice and same test repeated at postnatal day 50 showed dramatically worsened performance of mutant mice compared to control mice. N = 7 for control, N = 6 for mutant, **p = 0.004, two-tailed t test. D, Footprint assay at postnatal week 7 showed ataxic gaits in mutant mice: distance between two hindpaws increased and the overlaps between front and hindpaws of the same side were poor. Red paint, Front paws; green paint, hindpaws. N = 2 pairs. p < 0.0001 for hind base distance, p = 0.0004 for overlap, two-tailed t test. E, The Kaplan–Meier survival curves of control and mutant mice. Median survival days are 56 d for 73.12 line (mutant N = 19, control N = 20) and 68 d for 77.6 line (mutant N = 17, control N = 17).
Figure 3.
Figure 3.
Dicerflox/flox; mGfap-cre mutant mice had normal cerebellar development but around postnatal week 8–9, they had granule cell apoptosis and Purkinje cell dendrite degeneration. A, Compared to control mice, end-stage mutant mice brains showed cerebellar degeneration despite grossly normal morphology of other brain regions (observed with 100% penetrance). B, Nissl stainings of P7, P15, and P30 control and mutant littermate mice cerebella showed normal cerebellar development (N = 3 for each age). C, Nissl stainings of end-stage mutant cerebella showed severe cell loss (N > 10). D, Nissl stainings of late-stage symptomatic mutant mice showed massive condensed nuclei in cerebellar IGL (N = 4). Scale bar, 100 μm. E, TUNEL assays of symptomatic stage mutant mice brains showed massive IGL cells undergoing apoptosis (N = 4). F, A representative orthogonal image showed three-dimensional analysis of individual cells that were positive for both TUNEL and NeuN. Scale bar, 10 μm. G, Electron microscopy pictures showed that in late symptomatic stage mutant cerebella, granule cells became condensed and darkened as marked by arrows. Scale bar, 321 nm. N = 2. H, Calbindin stainings of Purkinje cell bodies and dendrites of symptomatic stage mutant and control cerebella (N = 3). Scale bar, 50 μm. I, Golgi stainings showed markedly reduced dendritic arborization of Purkinje cell in late symptomatic stage mutant cerebellum. Scale bar, 100 μm. N = 2. J, Representative electron microscopy pictures showed that compared to control littermate, late symptomatic stage mutant Purkinje cell dendrites (marked as PD) had increased electron density and surrounding Bergmann glia (marked by arrow) showed swollen cytoplasm with very low electron density. Scale bar, 321 nm. N = 2.
Figure 4.
Figure 4.
Astroglial morphological changes occurred before neurological symptoms. A, Gfap DAB stainings showed no difference at early postnatal stages (P15) and the earliest morphological changes were observed at ∼P30. B, Bergman glia in mutant cerebella showed increased Gfap staining. C, Quantification of molecular layer Gfap immunofluorescence fold change of presymptomatic (P24–P32) and early symptomatic (P42–P48) mice cerebella. Two-tailed t test, *p < 0.05, ***p < 0.001. D, IGL astrocytes showed decreased Gfap and S100β staining. E, Quantification of granule layer Gfap immunofluorescence fold change of presymptomatic (P24–P32) and early symptomatic (P42–P48) mice cerebella. Two-tailed t test, ***p < 0.001.
Figure 5.
Figure 5.
Transcription profiling of control versus mutant mice cerebella at presymptomatic stage (P30) showed a cohort of astrocytic genes dysregulated. A, Heat map representations of relative changes in gene expression (from four pairs of littermate cerebella) between control and mutant cerebella at the presymptomatic stage were shown for differentially expressed genes (FDR < 0.05). B, Heat map representations of cerebellar cell type-specific expression patterns of differentially expressed genes between control and mutant cerebella. The heat map is ranked by changes in expression between control and mutant cerebella. The information on cell type-specific gene expression profiles was derived from a previously published dataset (Doyle et al., 2008). There were 263 upregulated genes and 208 downregulated genes mappable to the reference dataset. The cell type-specific enrichment score represented the measurement of relative expression level of a given gene compared to a universal reference. C, Tables showed representative upregulated (red) and downregulated genes (green) by gene ontology analyses. D, RT-QPCR validation of representative upregulated genes. Two-tailed paired t tests, N = 4. *p < 0.05, **p < 0.01, or ***p < 0.005. E, RT-QPCR validation of representative downregulated genes involved in oxidation reduction and glutamate transport. Two-tailed paired t tests, N = 4, *p < 0.05, **p < 0.01.
Figure 6.
Figure 6.
Astroglial glutamate uptake pathway is severely compromised in mutant cerebella. A, B, Western blots and quantifications demonstrated that GLT-1 protein level was markedly downregulated at presymptomatic stage and continued to decrease until end-stage. C, D, Similarly, Western blots and quantifications showed that GLAST protein level was markedly downregulated at presymptomatic stage and continued to decrease until end-stage. E, Glutamate uptake assays with crude cerebellar synaptosomes at early symptomatic stage (P40) and late symptomatic stage (P60) showed that mutant cerebellar glutamate uptake functions were severely compromised.
Figure 7.
Figure 7.
NMDA receptor-mediated tonic conductance significantly increased in mutant cerebellar granule neurons. A, Two representative traces showed the different amplitudes of NMDA receptor-mediated tonic currents. Horizontal bars indicated the application of the NMDA receptor antagonist d-AP5 (final concentration ≥ 50 μm). The dotted lines were the mean currents after complete blockade of NMDA receptors for calculating the magnitude of the NMDAR-mediated conductance. B, Representative traces showed that the application of 100 μm TBOA in bath induced a large increase of tonic conductance. The dotted lines indicated the basic conductance level held at +30 mV. C, Simulated distribution map of TBOA treatment potentiation fold for NMDA receptor-dependent conductance calculated by bootstrap statistics. Mean value of control cells was 20.0 with lower bound of 14.0 and higher bound of 26.0 with 95% confidence. Mean value of mutant cells was 3.9 with lower bound of 2.8 and higher bound of 5.2 with 95% confidence.
Figure 8.
Figure 8.
A model showed the essential roles of Dicer in regulating astrocytes maturation and functions. In the maturation process of astrocytes, Dicer-dependent pathway repressed genes that were involved in neural progenitor cell lineage, reactive astrocytes, and cell cycles while promoting transcription of mature astrocyte function genes in oxidation reduction, chemical homeostasis, etc. Deletion of Dicer in this process resulted in immature or reactive-like astrocytes that failed to support normal mature brain circuits.

References

    1. Apelt J, Schliebs R. Beta-amyloid-induced glial expression of both pro- and anti-inflammatory cytokines in cerebral cortex of aged transgenic Tg2576 mice with Alzheimer plaque pathology. Brain Res. 2001;894:21–30. - PubMed
    1. Barres BA. The mystery and magic of glia: a perspective on their roles in health and disease. Neuron. 2008;60:430–440. - PubMed
    1. Bartel DP. MicroRNAs: genomics, biogenesis, mechanism, and function. Cell. 2004;116:281–297. - PubMed
    1. Bushong EA, Martone ME, Jones YZ, Ellisman MH. Protoplasmic astrocytes in CA1 stratum radiatum occupy separate anatomical domains. J Neurosci. 2002;22:183–192. - PMC - PubMed
    1. Cahoy JD, Emery B, Kaushal A, Foo LC, Zamanian JL, Christopherson KS, Xing Y, Lubischer JL, Krieg PA, Krupenko SA, Thompson WJ, Barres BA. A transcriptome database for astrocytes, neurons, and oligodendrocytes: a new resource for understanding brain development and function. J Neurosci. 2008;28:264–278. - PMC - PubMed

Publication types

MeSH terms