. 2011 Jul;121(7):2750-67.
doi: 10.1172/JCI45014.

Identification of human triple-negative breast cancer subtypes and preclinical models for selection of targeted therapies

Affiliations

Identification of human triple-negative breast cancer subtypes and preclinical models for selection of targeted therapies

Brian D Lehmann et al. J Clin Invest. 2011 Jul.

Abstract

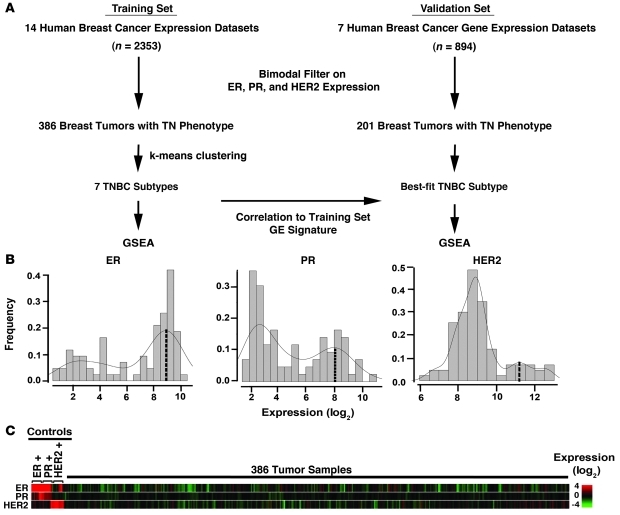
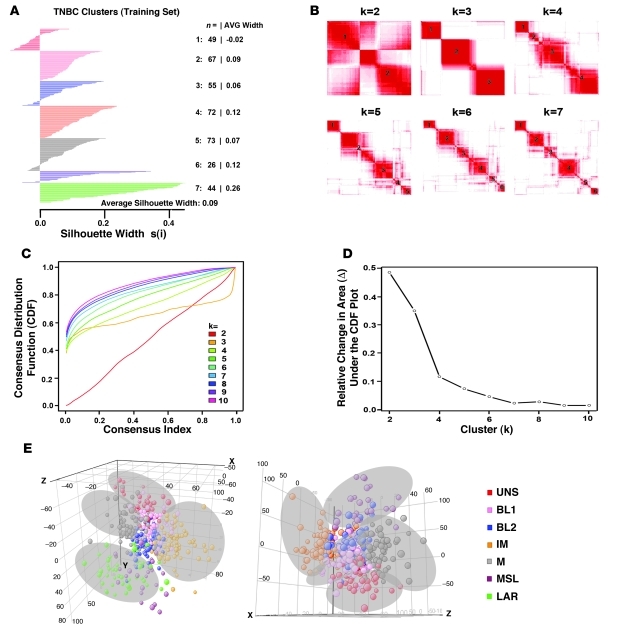
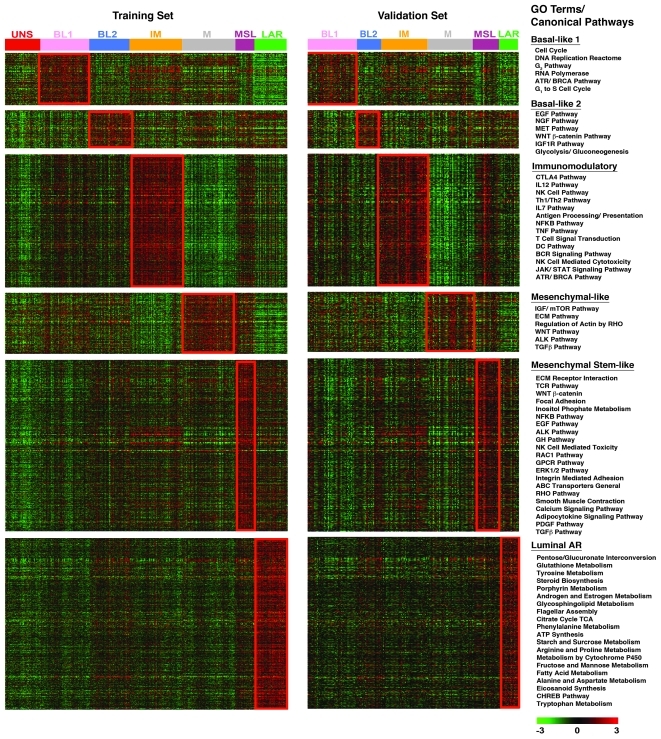
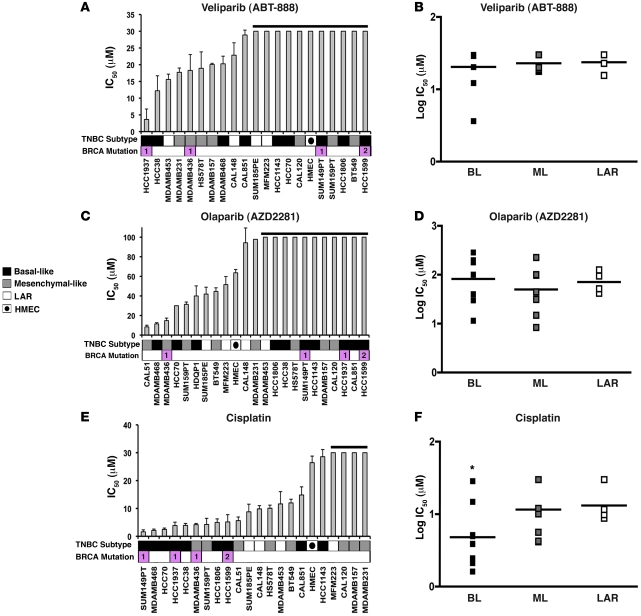
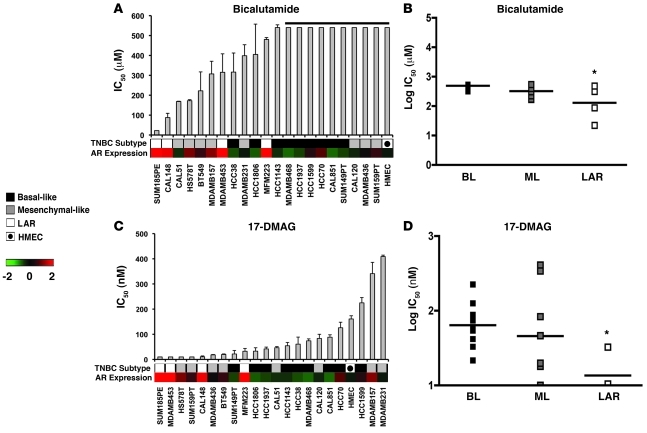
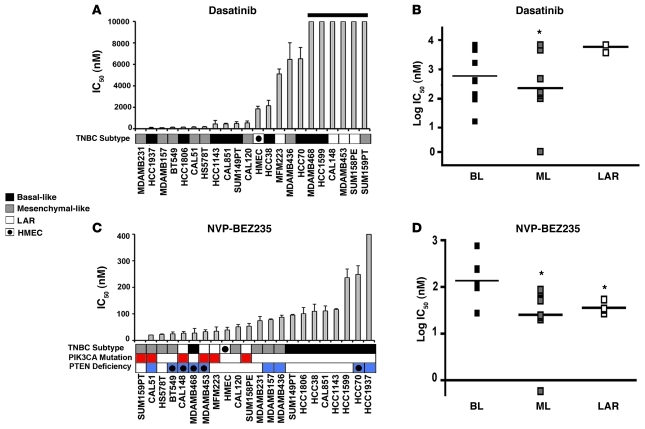
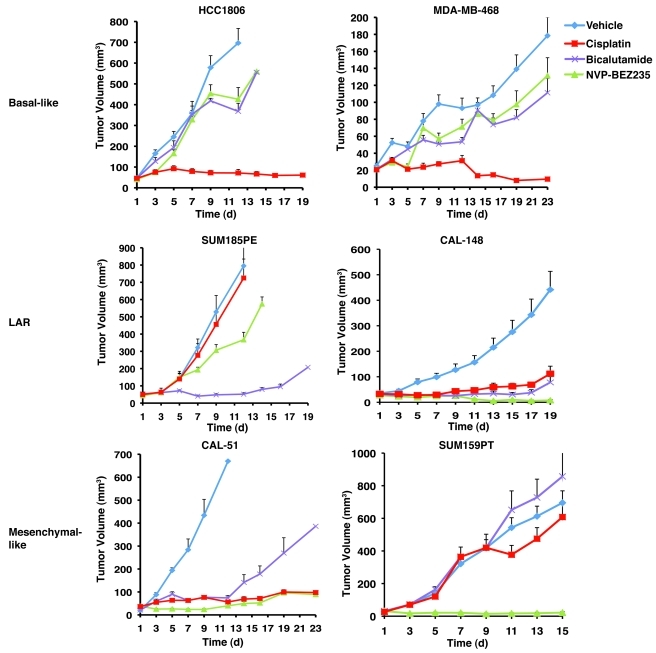
Triple-negative breast cancer (TNBC) is a highly diverse group of cancers, and subtyping is necessary to better identify molecular-based therapies. In this study, we analyzed gene expression (GE) profiles from 21 breast cancer data sets and identified 587 TNBC cases. Cluster analysis identified 6 TNBC subtypes displaying unique GE and ontologies, including 2 basal-like (BL1 and BL2), an immunomodulatory (IM), a mesenchymal (M), a mesenchymal stem-like (MSL), and a luminal androgen receptor (LAR) subtype. Further, GE analysis allowed us to identify TNBC cell line models representative of these subtypes. Predicted "driver" signaling pathways were pharmacologically targeted in these cell line models as proof of concept that analysis of distinct GE signatures can inform therapy selection. BL1 and BL2 subtypes had higher expression of cell cycle and DNA damage response genes, and representative cell lines preferentially responded to cisplatin. M and MSL subtypes were enriched in GE for epithelial-mesenchymal transition, and growth factor pathways and cell models responded to NVP-BEZ235 (a PI3K/mTOR inhibitor) and dasatinib (an abl/src inhibitor). The LAR subtype includes patients with decreased relapse-free survival and was characterized by androgen receptor (AR) signaling. LAR cell lines were uniquely sensitive to bicalutamide (an AR antagonist). These data may be useful in biomarker selection, drug discovery, and clinical trial design that will enable alignment of TNBC patients to appropriate targeted therapies.


Figures

Figure 1
Figure 1. Filtering GE data sets to identify TNBCs.
(A) Flow chart of analysis. Human breast cancer GE profiles (training = 2353, validation = 894) were normalized within individual data sets and a bimodal filter was applied to select ER, PR, and HER2 negative samples by GE, resulting in 386 samples in the training set and 201 samples in the validation set with a triple-negative phenotype. k-means clustering was performed on the training set, and a GE signature representing the TNBC subtypes from the training set was used to predict the best-fit subtype for each TNBC profile in an independent validation set. GSE-A was performed on the training and validation sets to identify enriched canonical pathways for each TNBC subtype. (B) Histograms show the distribution and frequency of tumors using relative ER, PR, and HER2 GE levels (log2) and bimodal fit to identify TN tumor samples. Dashed line indicates the expression value at the center of the positive expression peak used to select controls for C. (C) Heat map representation of GE for 386 TNBCs relative to 5 IHC-validated controls for each ER, PR, and HER2.
Figure 2
Figure 2. Identification of TNBC subtypes.
(A) Silhouette plot showing the composition (n = number of tumors) and stability (AVG width) of k-means clustering on the TNBC training set. Clusters with s(I) > 0 were considered stable. (B) Consensus clustering displaying the robustness of sample classification using multiple iterations (×1000) of k-means clustering. (C) The CDF depicting the cumulative distribution from consensus matrices at a given cluster number (k). (D) The optimal cluster number is 7 at the point in which the relative change in area (Δ) under the CDF plot does not change with increasing k. (E) Principal component analysis graphically depicting fundamental differences in GE between the TNBC clusters. The cluster (subtypes) are named as shown.
Figure 3
Figure 3. GE patterns within TNBC subtypes are reproducible.
Heat maps showing the relative GE (log2, –3 to 3) of the top differentially expressed genes (P < 0.05) in each subtype in the training set (left) and the same differentially expressed genes used to predict the best-fit TNBC subtype of the validation set (right). Overlapping gene ontology (GO) terms for top canonical pathways in both the training and validation sets as determined by GSE-A are shown to the right of the heat maps.
Figure 4
Figure 4. Basal-like TNBC subtypes have differential sensitivity to DNA-damaging agents.
IC50 values for TNBC cell lines treated with PARP inhibitors (A) veliparib, (C) olaparib, or (E) cisplatin for 72 hours. Error bars reflect SEM for 3 independent experiments. Black horizontal lines above various bars in the plots indicate cell lines that failed to achieve an IC50 at the highest dose of veliparib (30 μM), olaparib (100 μM), or cisplatin (30 μM). Cell lines that carry BRCA1 or BRCA2 mutations (pink) are displayed below the graph. Dot plot shows the log distribution of drug sensitivity to PARP inhibitors (B) veliparib, (D) olaparib, or (F) cisplatin in the basal-like subtypes (BL = BL1 + BL2), the mesenchymal-like subtypes (ML = M + MSL), and the LAR subtype. Black horizontal bars in the dot plot indicate the mean IC50 for each of the subtypes. *Statistically significant differences in IC50 values of BL compared with ML (P = 0.017) and LAR (P = 0.032), as determined by Mann-Whitney U test.
Figure 5
Figure 5. Differential sensitivity of the LAR TNBC subtype to AR and Hsp90 inhibitors.
IC50 values for each TNBC cell line after treatment with (A) bicalutamide or (C) the Hsp90 inhibitor 17-DMAG for 72 hours. Black bar above bicalutamide indicates cell lines that failed to achieve an IC50. Heat map displays relative AR expression (log2) across TNBC cell lines. Dot plot shows log distribution of drug sensitivity to (B) bicalutamide or (D) 17-DMAG in the basal-like (BL = BL1 + BL2), mesenchymal-like (ML = M + MSL), and LAR subtypes. Black horizontal bars in the dot plot indicate the mean IC50 for each of the subtypes. *Statistically significant differences in IC50 values of LAR versus BL (P = 0.007) or ML (P = 0.038) after bicalutamide and LAR versus BL and ML (P = 0.05) after 17-DMAG treatments, as determined by Mann-Whitney U test.
Figure 6
Figure 6. Mesenchymal-like TNBC subtypes are sensitive to dasatinib and NVP-BEZ235.
IC50 values for each TNBC cell lined treated with (A) dasatinib or (C) NVP-BEZ235 for 72 hours. Cell lines that have PIK3CA mutations (red) or are deficient in PTEN (blue, circle indicates mutated) are displayed below the NVP-BEZ235 graph. Dot plots show the log distribution of drug sensitivity to (B) dasatinib or (D) NVP-BEZ235 in the basal-like subtypes (BL = BL1 + BL2), mesenchymal-like subtypes (ML = M + MSL), and LAR. Black horizontal bars in the dot plots indicate the mean IC50 for each of the subtypes. *Statistically significant differences in IC50 values of BL versus ML (P = 0.020) when treated with dasatinib and ML versus BL (P = 0.001) and LAR versus BL (P = 0.01) when treated with NVP-BEZ235, as determined by Mann-Whitney U test.
Figure 7
Figure 7. Xenograft tumors established from TNBC subtypes display differential sensitivity to cisplatin, bicalutamide, and NVP-BEZ235.
Nude mice bearing established tumors (25–50 mm3) from basal-like (HCC1806 and MDA-MB-468), LAR (SUM185PE and CAL-148), or mesenchymal-like (CAL-51 and SUM159PT) were treated with cisplatin (red), bicalutamide (purple), NVP-BEZ235 (green), or vehicle (blue) for approximately 3 weeks. Serial tumor volumes (mm3) were measured at the indicated days. Each data point represents the mean tumor volume of 16 tumors; error bars represent SEM.

References

    1. Pegram MD, et al. Phase II study of receptor-enhanced chemosensitivity using recombinant humanized anti-p185HER2/neu monoclonal antibody plus cisplatin in patients with HER2/neu-overexpressing metastatic breast cancer refractory to chemotherapy treatment. J Clin Oncol. 1998;16(8):2659–2671. - PubMed
    1. Wiggans RG, et al. Phase-II trial of tamoxifen in advanced breat cancer. Cancer Chemother Pharmacol. 1979;3(1):45–48. - PubMed
    1. Carey LA, et al. The triple negative paradox: primary tumor chemosensitivity of breast cancer subtypes. Clin Cancer Res. 2007;13(8):2329–2334. doi: 10.1158/1078-0432.CCR-06-1109. - DOI - PubMed
    1. Morris GJ, et al. Differences in breast carcinoma characteristics in newly diagnosed African-American and Caucasian patients: a single-institution compilation compared with the National Cancer Institute’s Surveillance, Epidemiology, and End Results database. Cancer. 2007;110(4):876–884. doi: 10.1002/cncr.22836. - DOI - PubMed
    1. Haffty BG, et al. Locoregional relapse and distant metastasis in conservatively managed triple negative early-stage breast cancer. J Clin Oncol. 2006;24(36):5652–5657. doi: 10.1200/JCO.2006.06.5664. - DOI - PubMed

Publication types

Substances