. 2011 Jul;121(7):2709-22.
doi: 10.1172/JCI45586.

Inhibition of PKCδ reduces cisplatin-induced nephrotoxicity without blocking chemotherapeutic efficacy in mouse models of cancer

Affiliations

Inhibition of PKCδ reduces cisplatin-induced nephrotoxicity without blocking chemotherapeutic efficacy in mouse models of cancer

Navjotsingh Pabla et al. J Clin Invest. 2011 Jul.

Abstract

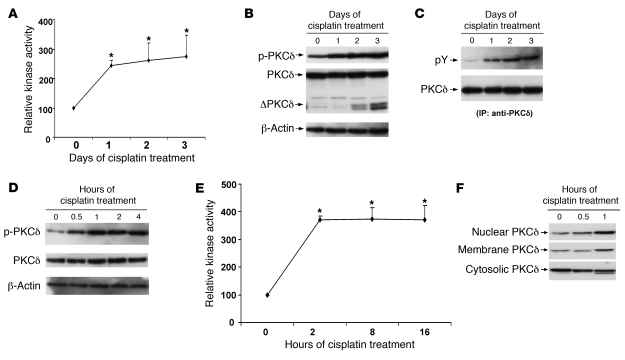
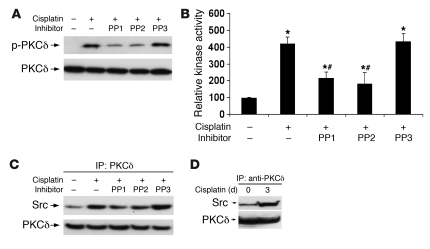
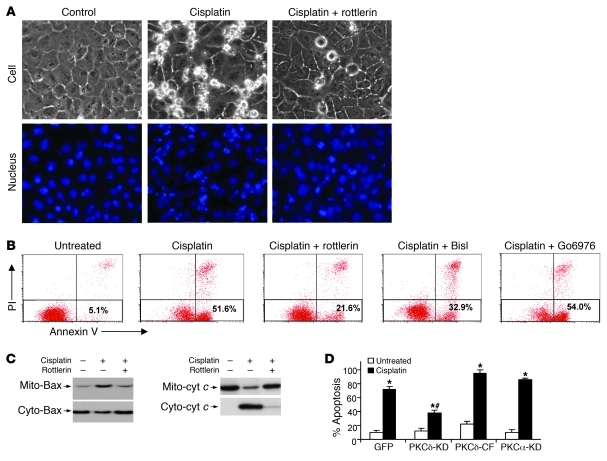
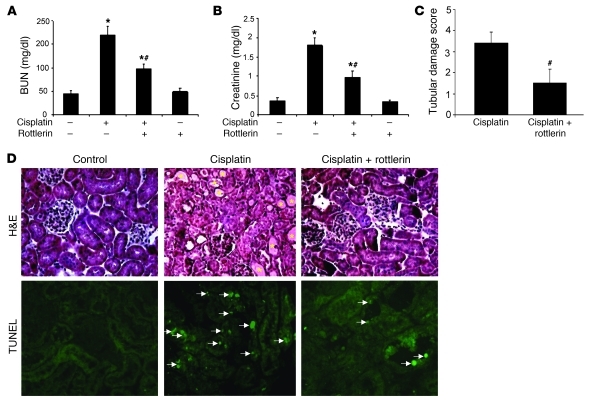
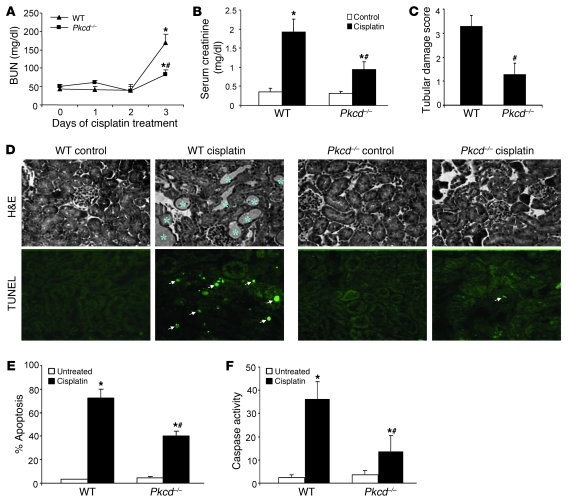
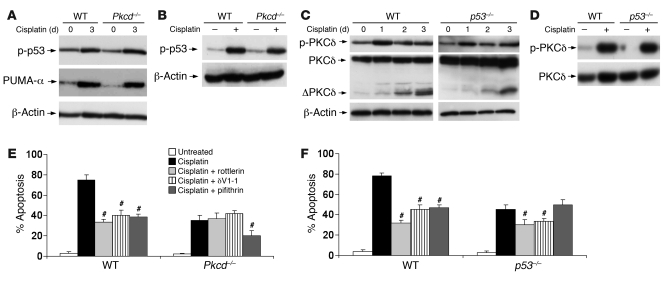
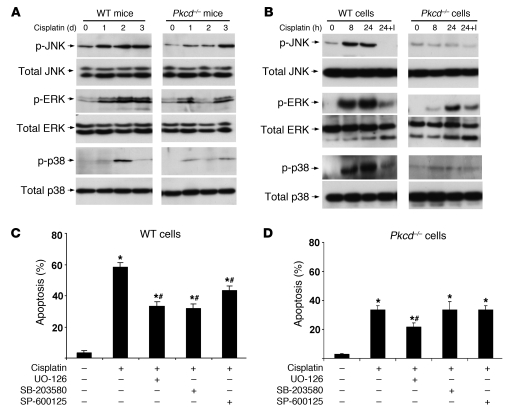
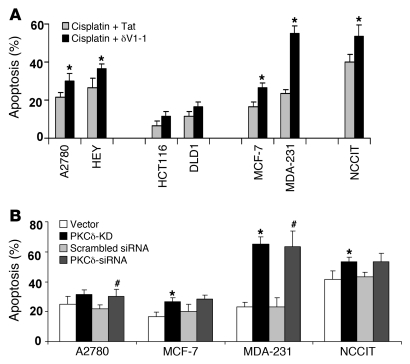
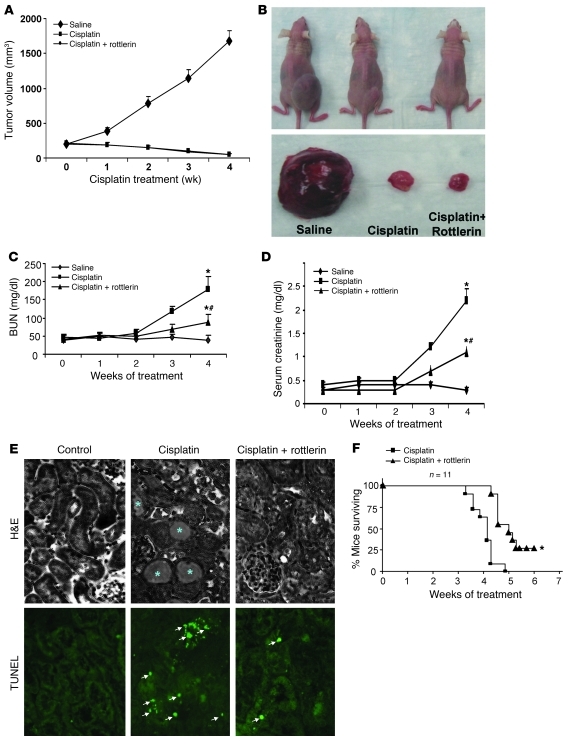
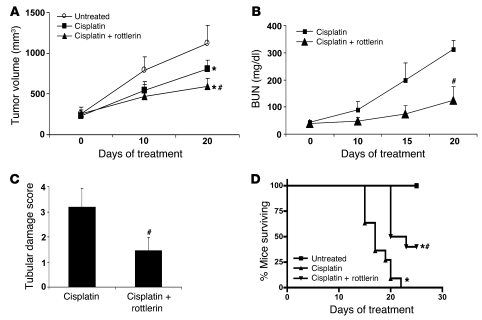
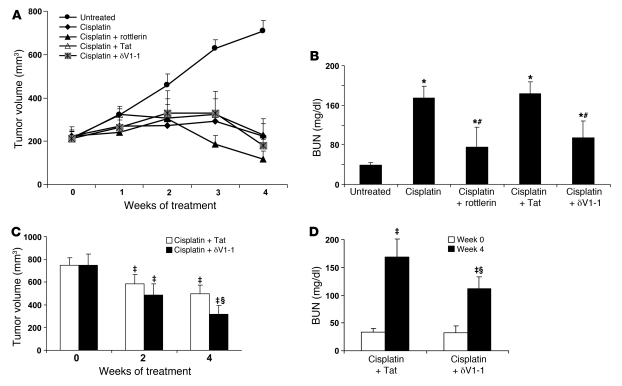
Cisplatin is a widely used cancer therapy drug that unfortunately has major side effects in normal tissues, notably nephrotoxicity in kidneys. Despite intensive research, the mechanism of cisplatin-induced nephrotoxicity remains unclear, and renoprotective approaches during cisplatin-based chemotherapy are lacking. Here we have identified PKCδ as a critical regulator of cisplatin nephrotoxicity, which can be effectively targeted for renoprotection during chemotherapy. We showed that early during cisplatin nephrotoxicity, Src interacted with, phosphorylated, and activated PKCδ in mouse kidney lysates. After activation, PKCδ regulated MAPKs, but not p53, to induce renal cell apoptosis. Thus, inhibition of PKCδ pharmacologically or genetically attenuated kidney cell apoptosis and tissue damage, preserving renal function during cisplatin treatment. Conversely, inhibition of PKCδ enhanced cisplatin-induced cell death in multiple cancer cell lines and, remarkably, enhanced the chemotherapeutic effects of cisplatin in several xenograft and syngeneic mouse tumor models while protecting kidneys from nephrotoxicity. Together these results demonstrate a role of PKCδ in cisplatin nephrotoxicity and support targeting PKCδ as an effective strategy for renoprotection during cisplatin-based cancer therapy.


Figures

Figure 1
Figure 1. PKC-δ activation during cisplatin treatment in mice and RPTCs.
(A) Kinase assay of PKCδ activity in kidney tissues. Male C57BL/6 mice of 8 to 10 weeks of age were injected with 30 mg/kg cisplatin before collection of renal tissues at day 0–3. PKCδ was immunoprecipitated from tissue lysate and in vitro kinase reaction with the substrate histone H1 and [γ-32P]ATP. Histone H1 phosphorylation was analyzed by SDS-PAGE and autoradiography to indicate kinase activity. (B) PKCδ phosphorylation at tyr-311 in kidney tissues. Kidney tissue lysate was analyzed by immunoblot analysis for phosphorylated (tyr-311) PKCδ (p-PKCδ), total PKCδ, or β-actin. (C) Tyrosine phosphorylation of PKCδ during cisplatin treatment in vivo. PKCδ was immunoprecipitated from control and cisplatin-treated renal tissues for immunoblot analysis of phosphotyrosine (pY). (D) PKCδ (tyr-311) phosphorylation during cisplatin treatment in vitro. RPTCs were treated with 20 μM cisplatin for 0 to 4 hours to collect whole cell lysates for immunoblot analysis of total and phosphorylated (tyr-311) PKCδ. (E) In vitro kinase assay of PKCδ activation in RPTCs. RPTCs were treated with 20 μM cisplatin for 0 to 16 hours to collect whole cell lysates for PKCδ immunoprecipitation and kinase activity assay. (F) Translocation of PKCδ during cisplatin treatment. RPTCs were treated with cisplatin for 0 to 1 hours and then fractionated into nuclear, membrane, and cytosolic fractions for immunoblot analysis of PKCδ. Mean ± SD, n = 4. *P < 0.001 versus control.
Figure 2
Figure 2. The role of Src in cisplatin-induced PKCδ activation.
RPTCs were treated with 20 μM cisplatin for 4 hours in the absence or presence of 20 μM Src inhibitors, PP1 and PP2, or the control compound PP3. (A) Inhibition of PKCδ (tyr-311) phosphorylation during cisplatin treatment by Src inhibitors. Whole cell lysates were collected for immunoblotting of phosphorylated (tyr-311) PKCδ and total PKCδ. (B) Inhibition of PKCδ activity during cisplatin treatment by Src inhibitors. Whole cell lysates were collected for PKCδ immunoprecipitation and in vitro kinase assay. Mean ± SD, n = 4. *P < 0.001 versus control; #P < 0.001 versus cisplatin-only group. (C) Coimmunoprecipitation of Src and PKCδ. Whole cell lysates were collected for immunoprecipitation of PKCδ. The immunoprecipitates were analyzed for the presence of Src and PKCδ by immunoblotting. (D) Coimmunoprecipitation of Src and PKCδ during cisplatin nephrotoxicity in vivo. C57BL/6 mice were injected with 30 mg/kg cisplatin before collection of renal tissues at days 0 and 3. The tissue lysates were immunoprecipitated using an anti-PKCδ antibody, and the immunoprecipitates were examined for Src and PKCδ by immunoblotting.
Figure 3
Figure 3. Effects of PKCδ inhibition on cisplatin-induced apoptosis in RPTCs.
(AC) RPTCs were treated with 20 μM cisplatin for 16 hours in the absence or presence of 10 μM rottlerin, BisI, or Go6976. (A) Morphology. After treatment, cells were stained with Hoechst33342. Cellular and nuclear morphology was recorded by phase-contrast and fluorescence microscopy. Original magnification, ×400. (B) Flow cytometric analysis of apoptosis. After treatment, cells were stained with Annexin V–FITC and PI for flow cytometry. Values in the plots represent percentages of Annexin V–FITC–positive cells. (C) Inhibition of Bax translocation and cytochrome c (cyt c) release during cisplatin treatment by rottlerin. Cells were fractionated into cytosolic (cyto) and membrane-bound organellar fractions for immunoblot analysis of Bax and cytochrome c. Mito, mitochondria. (D) Inhibition of cisplatin-induced apoptosis by dominant-negative PKCδ. RPTCs were cotransfected with pEGFP-C3 and a PKC plasmid (PKCδ-KD, PKCδ-CF, or PKCα-KD), and then treated with 20 μM cisplatin for 16 hours. Transfected cells (expressing GFP) were examined for the percentage of apoptosis by morphological criteria. Mean ± SD, n = 4. *P < 0.05 versus untreated control cells, #P < 0.05 versus cisplatin-treated GFP/empty vector–transfected cells.
Figure 4
Figure 4. Effects of rottlerin on cisplatin-induced nephrotoxicity in vivo in mice.
Male C57BL/6 mice of 8 to 10 weeks of age were injected with saline (control), 30 mg/kg cisplatin, 30 mg/kg cisplatin plus 10 mg/kg rottlerin, or 10 mg/kg rottlerin. Blood samples were collected at day 3 to measure (A) BUN and (B) serum creatinine. Renal tissues were also collected and processed for H&E staining to evaluate (C) tubular damage and (D) histology. Mean ± SD, n = 4. *P < 0.001 versus untreated control group; #P < 0.05 versus cisplatin-only group. (D) Apoptosis was examined by TUNEL assay. Arrows indicate TUNEL-positive nuclei. Original magnification, ×200.
Figure 5
Figure 5. Resistance of Pkcd–/– mice and renal tubular cells to cisplatin-induced injury.
(AD) Wild-type and Pkcd–/– mouse littermates (male, 8–10 weeks of age) were injected with 30 mg/kg cisplatin. (A) Blood samples were collected at days 0, 1, 2, and 3 to measure BUN. At day 3, the animals were sacrificed to collect blood samples (B) to measure serum creatinine and (C and D) to collect kidney tissues for H&E staining and histological analysis and TUNEL assay of apoptosis. Asterisks in D indicate lysed tubules, and arrows indicate TUNEL-positive nuclei. Original magnification, ×200. (E and F) Kidney proximal tubular cells were isolated from wild-type and Pkcd–/– mice for primary culture. The cells were left untreated or treated with 30 μM cisplatin for 20 hours. Apoptosis was evaluated by cell morphology, and caspase activity was measured by enzymatic assay. Mean ± SD, n = 4. *P < 0.001 versus untreated control group; #P < 0.05 versus treated wild-type group.
Figure 6
Figure 6. Independent regulation of p53 and PKCδ during cisplatin nephrotoxicity.
(A) Cisplatin-induced p53 activation in kidney tissues. Wild-type and Pkcd–/– mice were injected with 30 mg/kg cisplatin before collection of whole kidney lysates for immunoblotting. (B) Cisplatin-induced p53 activation in primary Pkcd–/– kidney tubular cells. The cells were incubated with 50 μM cisplatin for 24 hours to collect lysate for immunoblotting. (C) Cisplatin-induced PKCδ activation in kidney tissues. Wild-type and p53–/– mice were injected with 30 mg/kg cisplatin before collection of whole kidney lysates for immunoblotting. (D) Cisplatin-induced PKCδ activation in primary p53–/– kidney tubular cells. The cells were incubated for 24 hours with 50 μM cisplatin to collect lysate for immunoblotting. (E) Effects of pifithrin-α and rottlerin on cisplatin-induced apoptosis in primary Pkcd–/– kidney tubular cells. The cells were treated for 24 hours with 50 μM cisplatin in the absence or presence of 10 μM rottlerin or 20 μM pifithrin-α to determine the percentage of apoptosis by morphological methods. (F) Effects of pifithrin-α and rottlerin on cisplatin-induced apoptosis in primary wild-type and p53–/– kidney tubular cells. The cells were treated for 24 hours with 50 μM cisplatin in the absence or presence of 10 μM rottlerin or 20 μM pifithrin-α to determine the percentage of apoptosis by morphological methods. Mean ± SD, n = 4. #P < 0.05 versus the cisplatin group of the same genotype cells.
Figure 7
Figure 7. Regulation of MAPK by PKCδ during cisplatin nephrotoxicity.
(A) MAPK activation during cisplatin nephrotoxicity in wild-type and Pkcd–/– mice. Male wild-type and Pkcd–/– mice of 8 to 10 weeks of age were injected with 30 mg/kg cisplatin. Whole kidney lysates were collected at days 0–3 for immunoblot analysis of phosphorylated and total JNK, ERK, and p38. (B) Cisplatin-induced MAPK activation in primary cultures of wild-type and Pkcd–/– kidney proximal tubular cells. The cells were incubated for 0, 8, 24 hours with 50 μM cisplatin or cisplatin and a MAPK inhibitor (24+I: 5 μM U0126, 10 μM SP600125, or 10 μM SB203580). Whole cell lysates were collected for immunoblot analysis of phosphorylated and total JNK, ERK, and p38. (C and D) Effects of MAPK inhibitors on cisplatin-induced apoptosis in wild-type and Pkcd–/– kidney proximal tubular cells. Kidney proximal tubular cells isolated from (C) wild-type and (D) Pkcd–/– mice were incubated for 24 hours with 50 μM cisplatin in the absence (–) or presence (+) of 5 μM U0126, 10 μM SP600125, or 10 μM SB203580. The percentage of apoptosis was determined by counting the cells with typical apoptotic morphology. Blots in A and B are representatives of at least 3 separate experiments. Mean ± SD, n = 4. *P < 0.001 versus untreated control group; #P < 0.05 versus cisplatin-only group.
Figure 8
Figure 8. Effect of PKCδ inhibition on cisplatin-induced apoptosis in multiple cancer cell lines.
(A) Effect of PKCδ inhibitor δV1-1 on cisplatin-induced apoptosis in cancer cells. Indicated cell lines were pretreated with 2 μM Tat or δV1-1 peptide for 1 hour in reduced serum medium before treating with 25 μM cisplatin for 24 hours, and apoptosis was monitored as described in Methods. Mean ± SD, n = 3. *P < 0.05 versus cisplatin plus Tat group. (B) Effect of genetic inhibition of PKCδ on cisplatin-induced apoptosis. Indicated cell lines were transfected with either empty vector, PKCδ-KD, scrambled siRNA, or PKCδ-siRNA, and 48 hours after transfection, the cells were treated with 20 μM cisplatin for 24 hours, and apoptosis was estimated. Mean ± SD, n = 3. *P < 0.05 versus vector group; #P < 0.05 versus scrambled siRNA group.
Figure 9
Figure 9. Rottlerin ameliorates cisplatin-induced kidney injury without blocking the therapeutic effects in human ovarian tumor xenografts.
Tumor xenografts were established in athymic nude mice by inoculation of A2780 ovarian cancer cells. After the tumors had grown to approximately 200 mm3, the animals were then randomly divided into 3 groups (11 mice/group), which were treated weekly with saline, 10 mg/kg cisplatin, or 10 mg/kg cisplatin plus 10 mg/kg rottlerin. (A) Tumor volume during treatment. Tumors were measured each week to determine tumor volume. (B) Representative mice and dissected tumors. (C) BUN values during the treatment. (D) Serum creatinine levels during the treatment. (E) Representative renal histology and TUNEL staining of tissues collected after 4 weeks of treatment. Original magnification, ×200. Asterisks in E indicate lysed tubules, and arrows indicate TUNEL-positive nuclei. (F) Animal death and survival during the treatment. Mean ± SD. *P < 0.05 versus untreated saline control group; #P < 0.05 versus cisplatin-only group.
Figure 10
Figure 10. Rottlerin protects kidneys while enhancing cisplatin chemotherapy in syngeneic ovarian tumor model.
C57BL/6 mice were injected subcutaneously with ID8-VEGF cells on the right flank. After the tumors had grown to approximately 200 mm3, the mice were randomly divided into 3 treatment groups (10 mice/group): saline, 10 mg/kg cisplatin, or 10 mg/kg cisplatin plus 10 mg/kg rottlerin. (A) Tumor volume during treatment. (B) BUN levels during treatment. (C) Mice were sacrificed after 20 days of treatment to collect renal tissues for H&E staining and histological analysis. (D) Animal death and survival during cisplatin treatment. Mean ± SD (n = 10 for day 0–15 data, n = 3 for day 20 cisplatin data, n = 5 for day 20 cisplatin plus rottlerin data). *P < 0.05 versus untreated saline control group; #P < 0.01 versus cisplatin-only group.
Figure 11
Figure 11. PKCδ inhibitor δV1-1 protect kidneys while enhancing cisplatin chemotherapy in human testicular and breast cancer tumor xenograft models.
(A and B) Human NCCIT testicular cancer cells were injected into the flanks of 6- to 8-week-old male nude mice to monitor tumor growth. In 2 weeks, the tumor volume increased to approximately 200 mm3, and the mice were divided into 5 groups (10 mice/group) for following treatments: saline (untreated), 20 mg/kg cisplatin, 20 mg/kg cisplatin plus 10 mg/kg rottlerin, 20 mg/kg cisplatin plus 3 mg/kg Tat peptide, and 20 mg/kg cisplatin plus 3 mg/kg δV1-1 peptide. Cisplatin and rottlerin were injected (i.p.) weekly. Tat and δV1-1 were injected (i.p.) biweekly. (A) Tumor volume. (B) BUN levels. (C and D) Human MDA-231 breast cancer cells were injected into the flanks of female nude mice. After the tumors grew to approximately 700 mm3, the mice were treated with 10 mg/kg cisplatin plus 3 mg/kg Tat or 10 mg/kg cisplatin plus 3 mg/kg δV1-1. (C) Tumor volume and (D) BUN levels were measured at indicated times. Mean ± SD, n = 6–10. *P < 0.05 versus untreated saline control group; P < 0.05 versus week 0; #P < 0.05 versus cisplatin-only group; §P < 0.05 versus cisplatin plus Tat group.

References

    1. Siddik ZH. Cisplatin: mode of cytotoxic action and molecular basis of resistance. Oncogene. 2003;22(47):7265–7279. - PubMed
    1. Wang D, Lippard SJ. Cellular processing of platinum anticancer drugs. Nat Rev Drug Discov. 2005;4(4):307–320. - PubMed
    1. Cepeda V, Fuertes MA, Castilla J, Alonso C, Quevedo C, Perez JM. Biochemical mechanisms of cisplatin cytotoxicity. Anticancer Agents Med Chem. 2007;7(1):3–18. - PubMed
    1. Einhorn LH. Curing metastatic testicular cancer. Proc Natl Acad Sci U S A. 2002;99(7):4592–4595. doi: 10.1073/pnas.072067999. - DOI - PMC - PubMed
    1. Launay-Vacher V, Rey JB, Isnard-Bagnis C, Deray G, Daouphars M. Prevention of cisplatin nephrotoxicity: state of the art and recommendations from the European Society of Clinical Pharmacy Special Interest Group on Cancer Care. Cancer Chemother Pharmacol. 2008;61(6):903–909. doi: 10.1007/s00280-008-0711-0. - DOI - PubMed

Publication types

MeSH terms