. 2011 Jun;4(3):157-72.
doi: 10.1593/tlo.10295. Epub 2011 Jun 1.

Molecular Validation of PACE4 as a Target in Prostate Cancer

Affiliations

Molecular Validation of PACE4 as a Target in Prostate Cancer

François D'Anjou et al. Transl Oncol. 2011 Jun.

Abstract

Prostate cancer remains the single most prevalent cancer in men. Standard therapies are still limited and include androgen ablation that initially causes tumor regression. However, tumor cells eventually relapse and develop into a hormone-refractory prostate cancer. One of the current challenges in this disease is to define new therapeutic targets, which have been virtually unchanged in the past 30 years. Recent studies have suggested that the family of enzymes known as the proprotein convertases (PCs) is involved in various types of cancers and their progression. The present study examined PC expression in prostate cancer and validates one PC, namely PACE4, as a target. The evidence includes the observed high expression of PACE4 in all different clinical stages of human prostate tumor tissues. Gene silencing studies targeting PACE4 in the DU145 prostate cancer cell line produced cells (cell line 4-2) with slower proliferation rates, reduced clonogenic activity, and inability to grow as xenografts in nude mice. Gene expression and proteomic profiling of the 4-2 cell line reveals an increased expression of known cancer-related genes (e.g., GJA1, CD44, IGFBP6) that are downregulated in prostate cancer. Similarly, cancer genes whose expression is decreased in the 4-2 cell line were upregulated in prostate cancer (e.g., MUC1, IL6). The direct role of PACE4 in prostate cancer is most likely through the upregulated processing of growth factors or through the aberrant processing of growth factors leading to sustained cancer progression, suggesting that PACE4 holds a central role in prostate cancer.


Figures

Figure 1
Figure 1
Relative mRNA expression levels of PCs in normal and tumoral prostate tissues. (A) Real-time PCRs from tissue specimens were performed with PACE4, furin, PC7, and PPIA specific primers. Nine normal prostate tissues and 47 prostate tumors (separated into three groups) were used for the comparative analyses. Clinical stage classification of prostate tumors, based on TNM system, was as follows: pT2, tumors strictly confined to the organ (18 samples); and pT3, tumors with extracapsular extensions (16 samples). Hormone-refractory prostate tumor tissues (13 samples) were issued from patients who relapsed after receiving endocrine therapy. Values are mean ± SEM. *P < .05, **P < .001. (B) PACE4 in situ hybridization in epithelial cells from normal and tumoral prostate tissues (arrows indicate purple staining corresponding to PACE4 mRNA).
Figure 2
Figure 2
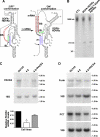
Down-regulation of PACE4 expression in DU145 cells. (A) The secondary structure of both the “OFF” and “ON” conformation of the SOFA module (box) attached to the classic HDVRz. The biosensor (in red, BS) and the blocker (in green, BL) can be modified to be hybridized on a specific mRNA target (N indicates A, C, G, or U). After the recognition of the mRNA, the P1 stem (in purple, P1) issued from the sequence-specific hybridization of the HDVRz with the targeted RNA will allow the catalytic cleavage of the latter, as indicated by the arrow. (B) Autoradiogram of in vitro cleavage assays performed with either the SOFA-HDVRz or the chimeric RNA transcript tRNAVal-SOFA-HDVRz both specific for PACE4 RNA. The control lane is the migration of the internally 32P-radiolabeled 3800 nt PACE4 RNA alone. The BS, BL, and P1 nucleotide sequences of the PACE4-SOFA-HDVRz used are indicated in the Materials and Methods section. XC indicates the position of xylene cyanol after migration on the denaturing 5% PAGE gel. (C and D) Autoradiograms of Northern blot hybridizations showing levels of PACE4 (C), furin (D), and PC7 (D) mRNA in untransfected DU145 cells (control cell line) or in cell lines either transfected with the expression vector coding for the tRNAVal-PACE4-SOFA-HDVRz alone (4-2) or cotransfected with a PACE4 cDNA expression vector (4-2 + PACE4) are shown. The bands corresponding to the 18S ribosomal RNA are shown for all blots. The size markers are shown on the right. The expression levels of PACE4 mRNA in transfected cell lines relative to the unstransfected DU145 cells were obtained by densitometric analyses using 18S ribosomal RNA as loading control (C). Values are mean ± SEM (n = 3). *P < .05.
Figure 3
Figure 3
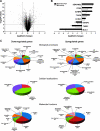
Microarray analysis and real-time PCR. (A) Volcano plot of differentially expressed genes in DU145 versus 4-2 cells measured with Illumina human expression bead chips. Vertical dashed lines show thresholds values for the fold change, whereas the horizontal dashed line indicates the threshold value for the P value (.05). Only genes with P values higher than the threshold with a log2(fold change) lower than -1 or higher than 1 were include in Tables W1 and W2, respectively. (B) Confirmation of values obtained with microarrays by real-time PCR. Amplification and detection of cDNA were performed using SYBR Green I dye. The expression levels, measured by real-time PCR (black bars), were normalized using β-actin as internal control. The white bars indicate values obtained from microarray analyses. (C) Classification of differentially expressed genes in 4-2 cells compared with DU145 according to their biologic processes, cellular localizations, and molecular functions. The PANTHER classification system (http://www.pantherdb.org) had no attributed gene ontology grouping for nine downregulated genes and six upregulated genes.
Figure 4
Figure 4
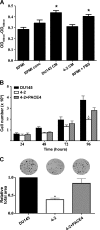
Proliferation of DU145 cells with reduced PACE4 expression. (A) MTT proliferation assay with conditioned media. DU145 cells (5.0 x 10³/well in triplicate) were incubated either with RPMI, concentrated RPMI (RPMI conc), DU145 conditioned medium (DU145 CM), or 4-2 CM for 48 hours. After treatment, MTT solution was added for 4.5 hours, and OD550nm - OD650nm of solubilized cells was measured and compared using untreated cells (RPMI) as reference. Values are mean ± SEM (n = 7). (B) Time-dependent proliferation of untransfected DU145 cells (DU145) or expressing tRNAVal-PACE4-SOFA-HDVRz with or without partially reestablished PACE4 expression (4-2 and 4-2 + PACE4, respectively) was assessed by counting total cell number after 24, 48, 72, and 96 hours of incubation time. Values are mean ± SEM (n = 3). (C) Colony formation after 10 days of incubation of DU145, 4-2, and 4-2 + PACE4 cell lines. Culture plates with fixed and stained cells were scanned, and the total particle area was measured. Typical result is illustrated for each cell line above in the upper part of the panel. The relative total area of the transfected cell lines compared with the control cell line is shown. Values are mean ± SEM (n = 9 for DU145 and 4-2 + PACE4 and n = 7 for 4-2). *P < .05.
Figure 5
Figure 5
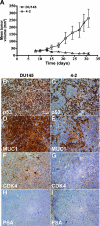
In vivo tumorigenicity assay and immunohistochemistry. (A) 3.0 x 10⁶ DU145 and 4-2 cells were subcutaneously injected in 4-week-old nu/nu female mice (two injections/mice, five mice/group). The length and the width of the tumors were measured three times per week for 31 days. Values shown are mean ± SEM of tumors volumes for all tumors measured per mice group. Immunohistochemical staining of tumors derived fromDU145 and 4-2 cell lines for p53 (B, C), MUC1 (D, E), CDK4 (F, G), and PSA (H, I) proteins. All images were acquired at the same magnification (100x).
Figure 6
Figure 6
Cell cycle analysis and identification of an apoptotic biomarker by MALDI-TOF/TOF. (A) DNA content of DU145, 4-2 and 4-2 + PACE4 cells was determined by flow cytometric analysis using PI staining without cell fixation. The 4-2 cells showed a higher level of fragmented DNA than DU145 and 4-2 + PACE4 cells (12.30%, 1.74%, and 3.30%, respectively), indicating a higher population of hypodiploid cells for the 4-2 cell line, a characteristic of apoptotic cells. Inserts show the distribution of nonapoptotic cells into the phases of cell cycle. (B and C) Detection and identification of the apoptotic biomarker TRPS1 were done by MALDI-TOF/TOF in positive reflectron mode from different secretomes coming from triplicates of DU145 and 4-2 conditioned culture media after trypsin digestions. B represents the mass spectra comparison between conditioned media from both cell lines and the box shows a biomarker with a m/z of 1228 in 4-2 CM. C shows the identification by fragmentation of this peak as the zinc finger transcription factor TRPS1 by MALDI-TOF/TOF.

References

    1. Hanahan D, Weinberg RA. The hallmarks of cancer. Cell. 2000;100:57–70. - PubMed
    1. Bassi DE, Fu J, Lopez de Cicco R, Klein-Szanto AJ. Proprotein convertases: “master switches” in the regulation of tumor growth and progression. Mol Carcinog. 2005;44:151–161. - PubMed
    1. Khatib AM, Siegfried G, Chretien M, Metrakos P, Seidah NG. Proprotein convertases in tumor progression and malignancy: novel targets in cancer therapy. Am J Pathol. 2002;160:1921–1935. - PMC - PubMed
    1. Blanchard A, Iwasiow B, Yarmill A, Fresnosa A, Silha J, Myal Y, Murphy LC, Chretien M, Seidah N, Shiu RP. Targeted production of proprotein convertase PC1 enhances mammary development and tumorigenesis in transgenic mice. Can J Physiol Pharmacol. 2009;87:831–838. - PubMed
    1. de Cicco RL, Bassi DE, Benavides F, Conti CJ, Klein-Szanto AJ. Inhibition of proprotein convertases: approaches to block squamous carcinoma development and progression. Mol Carcinog. 2007;46:654–659. - PubMed

LinkOut - more resources