. 2011 Jun 24;34(6):947-60.
doi: 10.1016/j.immuni.2011.03.024.

Germinal center B cell and T follicular helper cell development initiates in the interfollicular zone

Affiliations

Germinal center B cell and T follicular helper cell development initiates in the interfollicular zone

Steven M Kerfoot et al. Immunity. .

Abstract

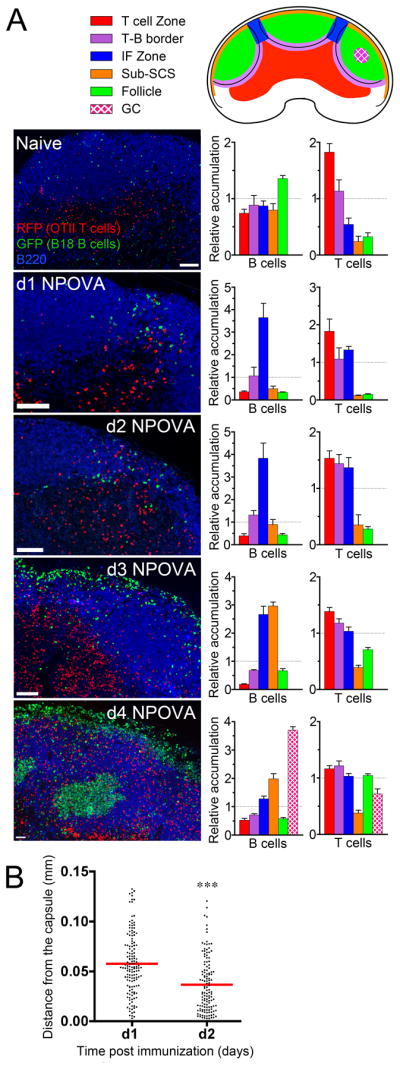
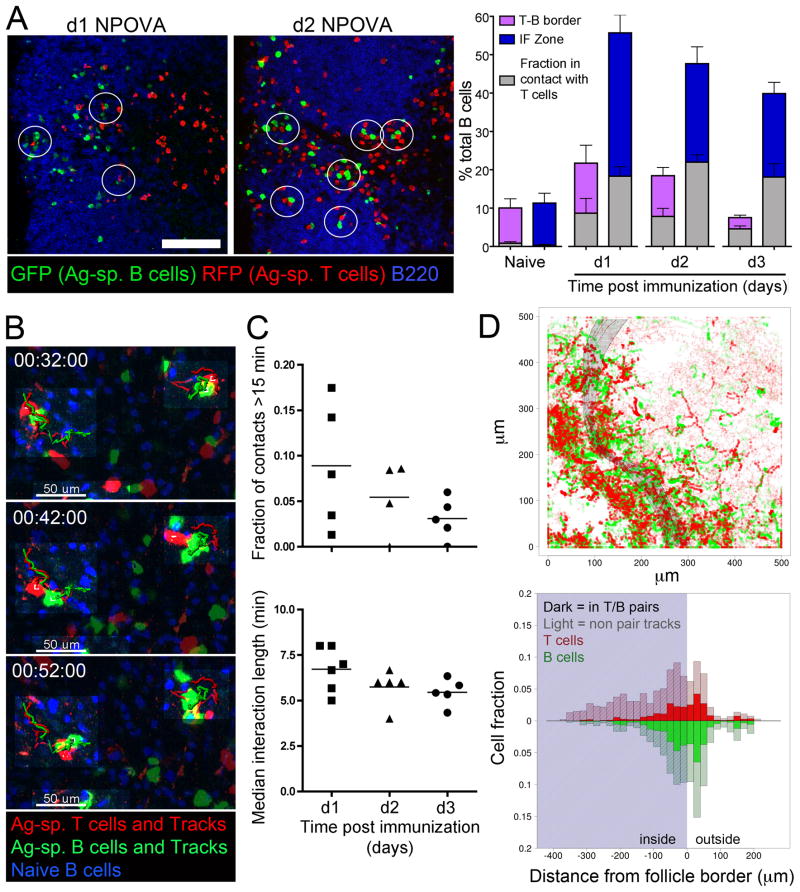
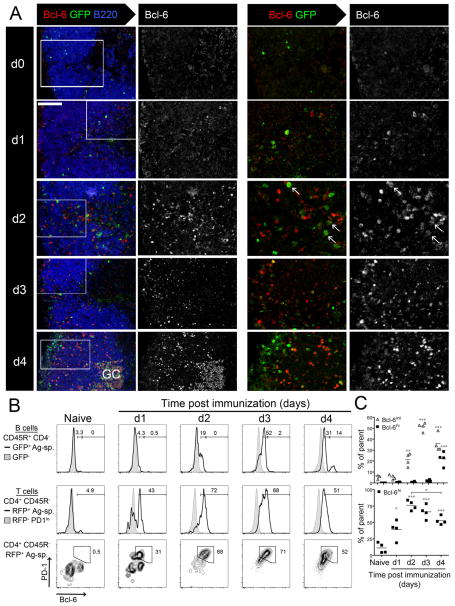
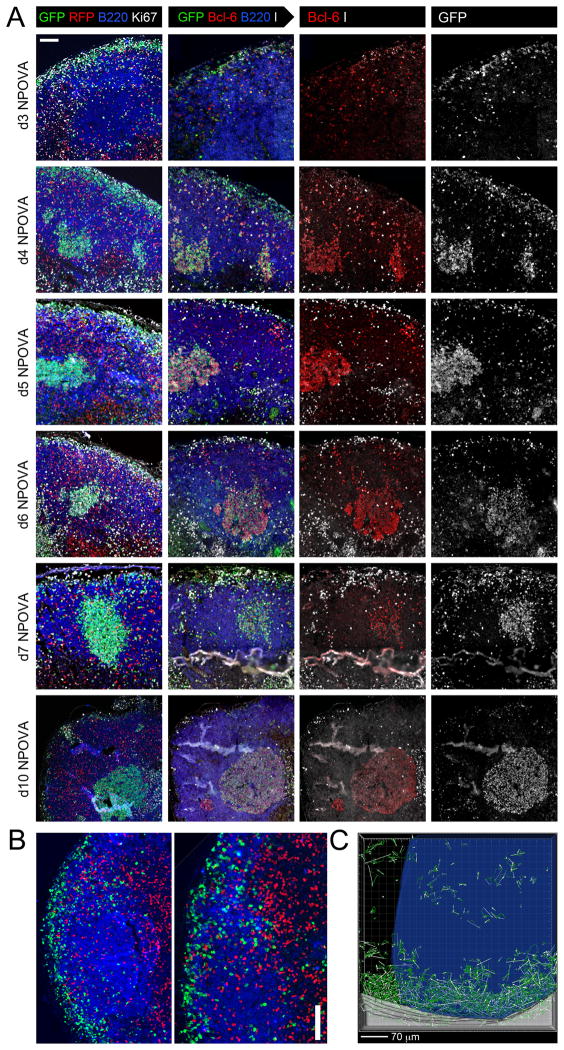
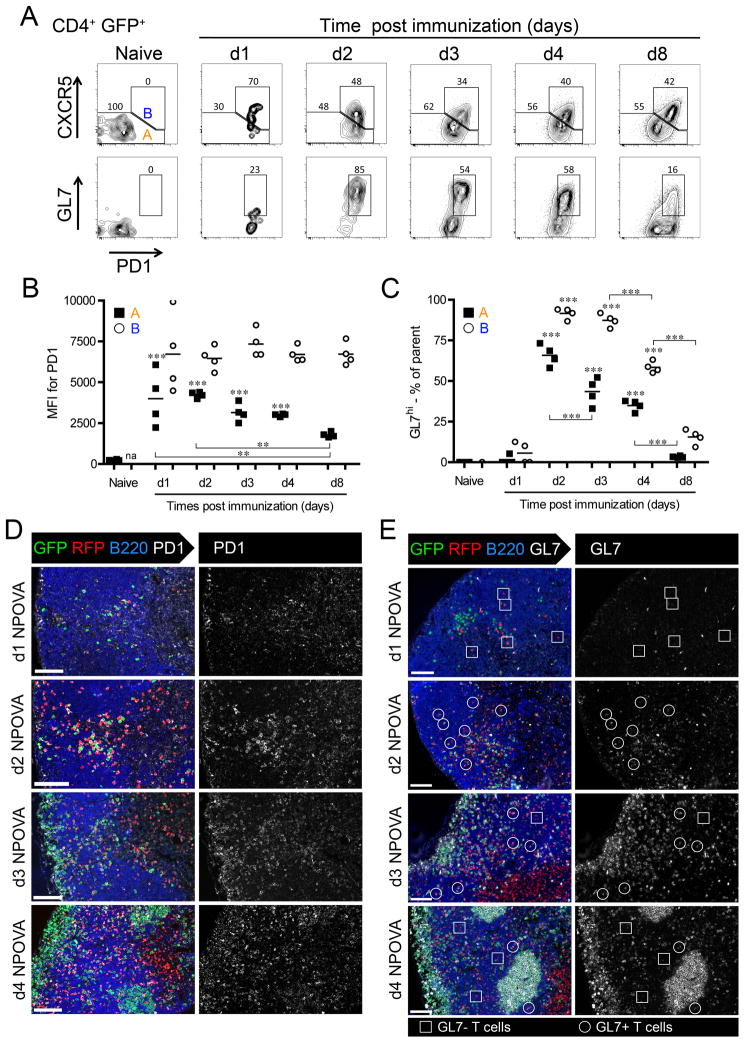
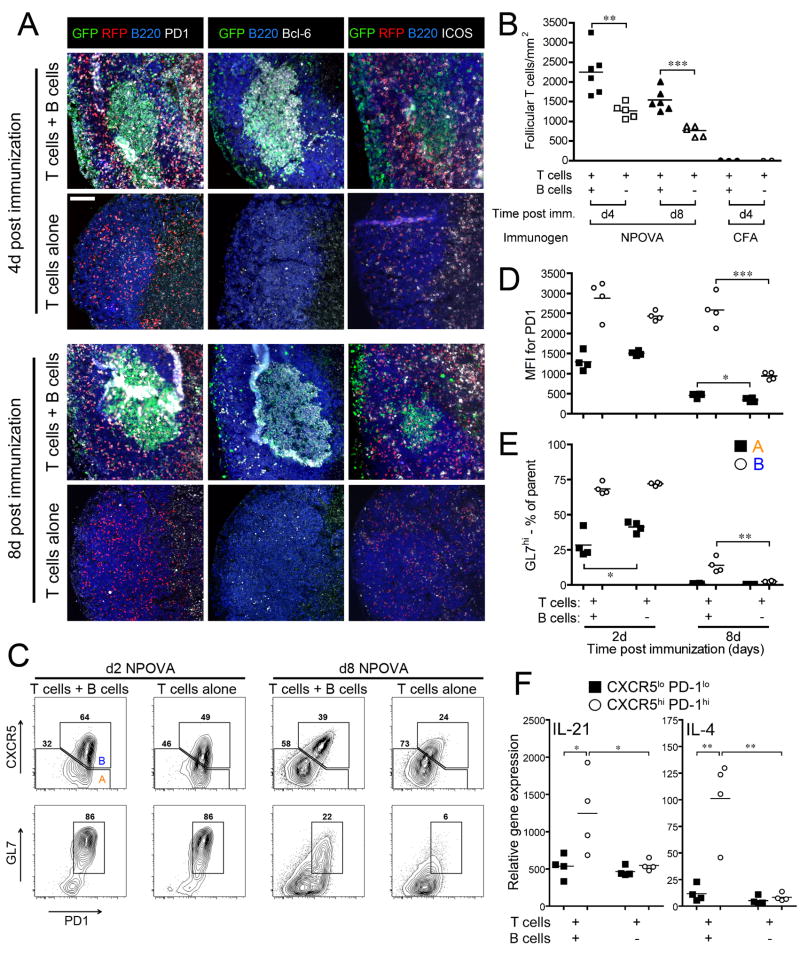
We identify the interfollicular (IF) zone as the site where germinal center B cell and T follicular helper (Tfh) cell differentiation initiates. For the first 2 days postimmunization, antigen-specific T and B cells remained confined within the IF zone, formed long-lived interactions, and upregulated the transcriptional repressor Bcl6. T cells also acquired the Tfh cell markers CXCR5, PD-1, and GL7. Responding B and T cells migrated to the follicle interior directly from the IF zone, T cell immigration preceding B cells by 1 day. Notably, in the absence of cognate B cells, Tfh cells still formed and migrated to the follicle. However, without such B cells, PD-1, ICOS, and GL7 were no longer expressed on follicular Bcl6(hi) T cells that nevertheless persisted in the follicle. Thus, Ag-specific B cells are required for the maintenance of the PD-1(hi)ICOS(hi)GL7(hi) Tfh cell phenotype within the follicle, but not for their initial differentiation in the IF zone.


Figures

Figure 1
Figure 1. Ag.-sp. T and B cell migration through lymph node microenvironments early in the GC response
NP-specific GFP+ B cells and OVA-specific RFP+ T cells were isolated and transferred to SMARTA TCR-Tg recipients, which were then immunized 1-3d later with NPOVA in CFA. Draining popliteal lymph nodes were harvested 1-4d later and prepared for histology. (A) Sections were stained for B220 to highlight follicles as well as GFP and RFP to identify Ag.-sp. B and T cells, respectively (left – scale bars represent 100μm). To quantify cell homing within lymph node microenvironments, different regions were identified based on follicular borders and the capsule (top right), as described in Experimental Procedures. Cells in each zone were counted in images of complete lymph node sections and the fraction for each cell type was divided by the fraction of the area, such that a value >1 = enrichment and <1 = exclusion (right). n = 5 for d0, 3 for d1, 6 for d2, 5 for d3, 6 for d4. See also Figure S1. (B) The distance between each GFP+ B cell to the capsule was measured in the IF zones of 3 separate lymph nodes (6 and 8 separate IF zones in total for d1 and d2, respectively). The red line represents the mean.
Figure 2
Figure 2. Two-photon microscopy of Ag.-sp. T and B cells in the IF zone
RFP+ and GFP+ Ag.-sp. T and B cells were transferred to SMARTA recipients and two- photon microscopy was performed on draining popliteal lymph nodes 1-3d post footpad immunization with NPOVA in CFA. CFP+ naïve, non-responding B cells were transferred 2d prior to imaging to visualize B cell follicle borders. (A) Tracks of Ag.-sp. T cells (top) and B cells (center) are overlaid on follicle borders (blue). A histogram of the mean distance for individual T and B cell tracks to the follicular border is plotted (bottom). One example of 4–6 experiments for each timepoint is shown. See also Movies S1-3. (B) T cells migrate deeper into the follicle than B cells 3d post immunization. Mean T vs. B cell distance from the follicle border was measured. Data points represent mean values from separate experiments. Linked T and B cell values represent paired data from the same experiment. * P<0.05. paired student’s t test. (C) Track and track displacement for selected T and B cells observed leaving the area of the IF zone moving into the follicle 3d post immunization are shown.
Figure 3
Figure 3. T and B cells continually form long-lived interactions in the IF zone 1-3d post immunization
(A) Representative immunofluorescence images of Ag.-specific (Ag-sp.) T and B cells in close contact in the IF zone 1 and 2 d post immunization. (scale bars = 100 μm). The fraction of GFP+ B cells in close contact with one or more RFP+ T cells in the IF zone vs. the T/B border is shown (right). (B) Still images from a multiphoton observation 2d post immunization showing the tracks of T and B cells migrating together in conjugate pairs (highlighted). See also Movie S4. (C) Long-term interactions between Ag.-sp. B and T cells were observed in the IF zone 1-3d post immunization. Interacting cells were identified as described in Experimental Procedures. The fraction of total interactions lasting longer than 15min (top) and median interaction duration (bottom) for individual experiments 1, 2 and 3d post immunization are shown. See also Figure S3. (D) Interacting T and B cells remain confined to the IF zone. The tracks of T and B cells identified to be in B/T interactions (bold) are overlaid on all T and B tracks (light) and the follicle border (top). A histogram of the mean distance for individual T and B cell tracks to the follicular border is plotted, with tracks in pairs shown in dark and not in pairs in light color (bottom). One representative of 4 experiments d3 post immunization is shown.
Figure 4
Figure 4. Differentiation of GC B cells and Tfh cells begins in the IF zone early in the GC response
(A) Sections were treated with an Ag-recovery protocol, which improves Bcl-6 staining while destroying RFP, prior to staining for Bcl-6, GFP and B220. Higher magnification images from the areas indicated in the left-most column are shown in the right two columns. For both panels A and B, representative images from at least 2 separate experiments of 4 or more lymph nodes for each timepoint are shown. Scale bar = 100 μm. Arrows point to examples of GFP+ cells also staining for Bcl-6. See also Figure S4C. (B, C) Flow cytometry analysis of Bcl-6 expression by Ag.-specific T and B cells in the developing GC response. RFP+ OVA-specific T cells and GFP+ NP-specific B cells were transferred to non-responding SMARTA recipients, which were immunized in the footpads with NPOVA in CFA. Transfers and immunizations were timed so that analysis was performed on the same day for all timepoints. Draining popliteal lymph nodes were collected and dissociated for flow cytometry. One representative of two separate experiments is shown. (B) Bcl-6 expression by Ag-specific (Ag-sp.) (GFP+) B cells (CD45R+ CD4) was compared to that of endogenous (GFP) B cells (top). Similarly, expression by Ag-specific (RFP+) T cells (CD4+ CD45R) was compared to that of non-responding endogenous (RFP PD-1) T cells (middle). Expression of Bcl-6 vs. the Tfh cell marker PD-1 for RFP+ T cells is shown (bottom). One representative histogram of four shown for each timepoint. (C) Bcl-6 expression by responding T cells precedes that of responding B cells. T cells expressing Bcl-6 were evident 1d post immunization (bottom), while B cells expressing intermediate levels of Bcl-6 were not present until 2d post immunization (top). % of the parent population is shown. *P<0.05, ** P<0.01, *** P<0.001 vs. Naive.
Figure 5
Figure 5. The region adjacent to the SCS is a site for B cell expansion, but not for GC B cell differentiation
(A) Immunofluorescence staining of lymph node sections from mice that had received GFP+ NP-specific B cells and RFP+ OVA-specific T cells. Serial sections stained with Bcl-6 (second panel from left and corresponding panels to the right showing only the Bcl-6 and Lambda channels and, furthest right, the GFP channel alone) underwent an antigen-recovery protocol that destroys RFP. Scale bars = 100 μm. See also Figure S5. (B) Immunofluorescence of 2 example 3d-post immunization lymph nodes demonstrating the continuity between the IF and SCS B cell populations. Labels as in panel A, left column. Scale bar = 100 μm. (C) Tracking data from a representative of 5 two-photon microscopy experiment 4d post immunization showing the tracks of Ag.-sp. B cells (green) adjacent to the capsule (grey) and follicle boundary (blue). See also Movie S5.
Figure 6
Figure 6. The Tfh cell phenotype emerges very early in the GC response
(A, B, C) Flow cytometry analysis of Ag-specific T cells in the developing GC response. GFP+ OVA-specific T cells and non-fluorescent NP-specific B cells were transferred to non-responding SMARTA recipients, which were immunized in the footpads with NPOVA in CFA. Transfers and immunizations were timed so that analysis was performed on the same day for all timepoints. Draining popliteal lymph nodes were collected and dissociated for flow cytometry. (A) Transferred T cells (CD4+ GFP+) were analyzed for the expression of Tfh cell markers CXCR5, PD1 and GL7. One representative plot of 4 is shown. (B) PD1 is highly expressed by nearly all responding T cells early in the response, but is only maintained on the CXCR5hi subset as the response matures. Mean fluorescence intensity (MFI) for PD1 for CXCR5hi and CXCR5lo cells (boxes A and B from panel A, naïve) is shown. nd – none detected. ** P<0.01, *** P<0.001 vs. Naive. See also Figure S6A. (C) Expression of the GL7-ligand is maintained on only a subpopulation of CXCR5hi PD1hi T cells. CXCR5hi and CXCR5lo cells (boxes A and B from panel A, naïve) were analyzed for GL7 staining. GL7hi as a % of the parent population is shown. *** P<0.001 vs. Naive. Figure S6B. (D, E) Immunofluorescence staining for Tfh cell markers on responding Ag.-sp. T cells in the IF zone. Lymph node sections from immunized SMARTA recipients of GFP+ NP-specific B cells and RFP+ OVA-specific T cells were stained for PD-1 (A) or GL7 (B). Scale bars = 100 μm.
Figure 7
Figure 7. Maintenance of the Tfh cell phenotype is dependent on cognate B cells, but the initial differentiation of the Tfh cell subset is not
(A) RFP+ Ag.-sp. T cells were transferred with and without cognate GFP+ B cells to MD4 BCR-Tg recipients. Popliteal lymph nodes were collected 4d and 8d post foot-pad immunization with NPOVA and prepared for immunofluorescence histology. Sections stained for Bcl-6 expression (center) were first treated with an antigen-recovery protocol that destroys RFP. One representative image of 5–6 lymph nodes shown for each group. Scale bars = 100 μm. (B) Quantification of Ag.-sp. T cells in the follicle in the presence and absence of cognate B cells. Each data point represents an individual lymph node. ** P<0.01, *** P<0.001 (C, D, E) Flow cytometry analysis of the Tfh cell phenotype in the absence of cognate B cells. GFP+ OVA-specific T cells were transferred with and without non-fluorescent NP-specific B cells to MD4 recipients, which were immunized in the footpads with NPOVA in CFA. Transfers and immunizations were timed so that analysis was performed on the same day for all timepoints. Draining popliteal lymph nodes were collected and dissociated for flow cytometry. (C) Transferred T cells (CD4+ GFP+) were analyzed for the expression of Tfh cell markers CXCR5, PD1 and GL7. One representative plot of 4 is shown. (D) PD1 expression by responding T cells is not effected by the absence of cognate B cells 2d post immunization, but is significantly reduced on CXCR5hi cells 8d post immunization in their absence. Mean fluorescence intensity (MFI) for PD1 for CXCR5hi and CXCR5lo cells (boxes A and B from panel C, left) is shown. *P<0.05, *** P<0.001. (E) GL7-ligand expression is unaffected 2d post immunization, but the GL7hi CXCR5hi population is largely lost 8d post immunization when cognate B cells are absent. CXCR5hi and CXCR5lo cells (boxes A and B from panel A, naïve) were analyzed for GL7 staining. Percent GL7+ for each population is shown. ** P<0.01, *** P<0.001. (F) IL-21 and IL-4 production by CXCR5hi T cells is lost in the absence of cognate T cells. GFP+ OVA-specific T cells were transferred with and without non-fluorescent NP-specific B cells to MD4 recipients, which were immunized in the footpads with NPOVA in CFA. Lymph nodes were harvested 8d later and CXCR5hi and CXCR5lo transferred T cells were sorted according to the gates described in panel C. cDNA was generated from mRNA the expression of the IL-21 and IL-4 genes relative to β-actin was determined by quantitative PCR. * P<0.05. n=4.

Comment in

References

    1. Akiba H, Takeda K, Kojima Y, Usui Y, Harada N, Yamazaki T, Ma J, Tezuka K, Yagita H, Okumura K. The role of ICOS in the CXCR5+ follicular B helper T cell maintenance in vivo. J Immunol. 2005;175:2340–2348. - PubMed
    1. Allen CDC, Okada T, Cyster JG. Germinal-center organization and cellular dynamics. Immunity. 2007;27:190–202. - PMC - PubMed
    1. Ansel KM, McHeyzer-Williams LJ, Ngo VN, McHeyzer-Williams MG, Cyster JG. In vivo-activated CD4 T cells upregulate CXC chemokine receptor 5 and reprogram their response to lymphoid chemokines. J Exp Med. 1999;190:1123–1134. - PMC - PubMed
    1. Batista FD, Harwood NE. The who, how and where of antigen presentation to B cells. Nat Rev Immunol. 2009;9:15–27. - PubMed
    1. Chen J, Trounstine M, Alt FW, Young F, Kurahara C, Loring JF, Huszar D. Immunoglobulin gene rearrangement in B cell deficient mice generated by targeted deletion of the JH locus. Int Immunol. 1993;5:647–656. - PubMed

Publication types