. 2011 Jun;4(6):803-17.
doi: 10.1158/1940-6207.CAPR-11-0212.

Characterizing the impact of smoking and lung cancer on the airway transcriptome using RNA-Seq

Affiliations

Characterizing the impact of smoking and lung cancer on the airway transcriptome using RNA-Seq

Jennifer Beane et al. Cancer Prev Res (Phila). 2011 Jun.

Abstract

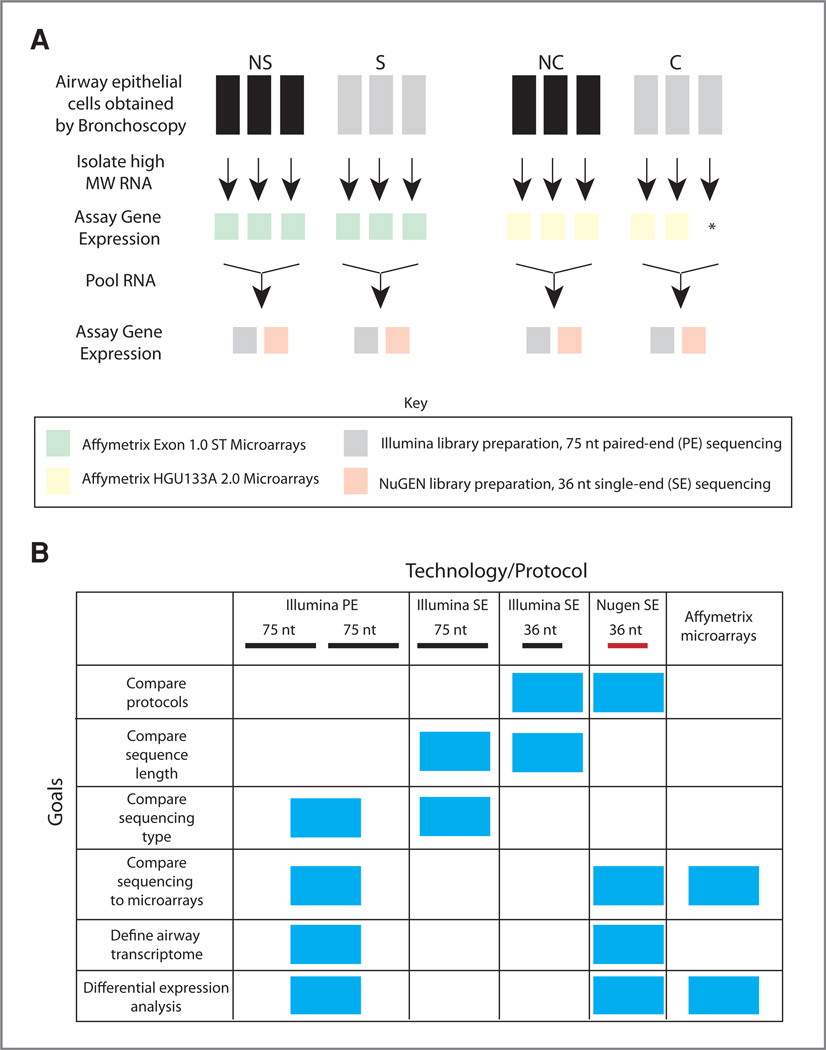
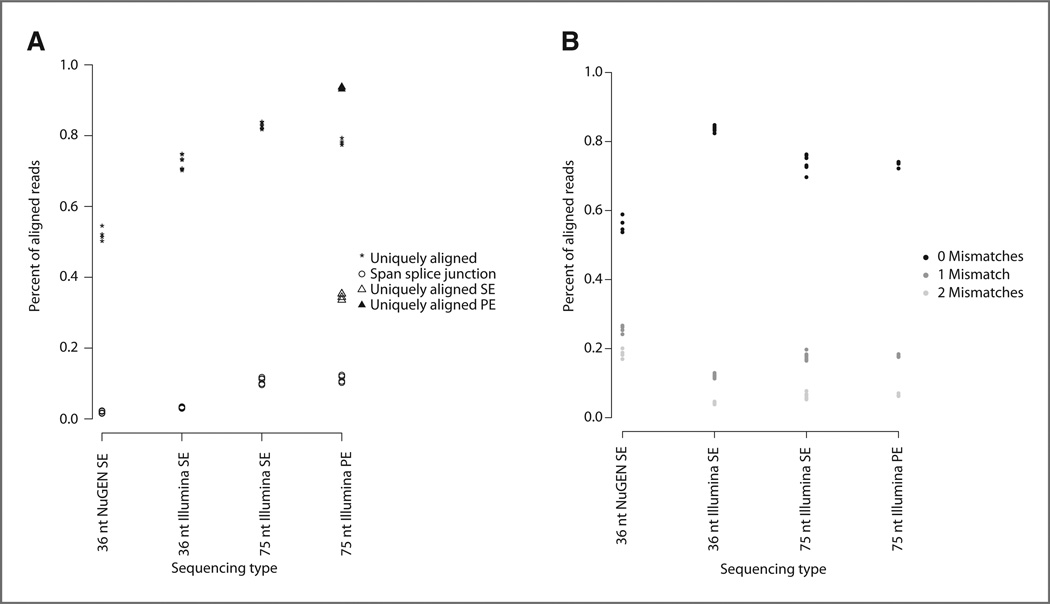
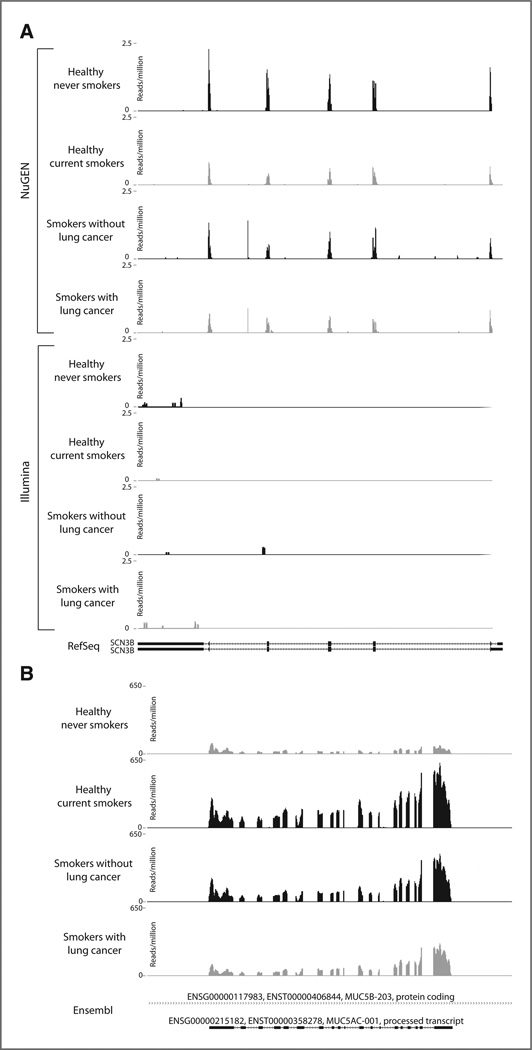
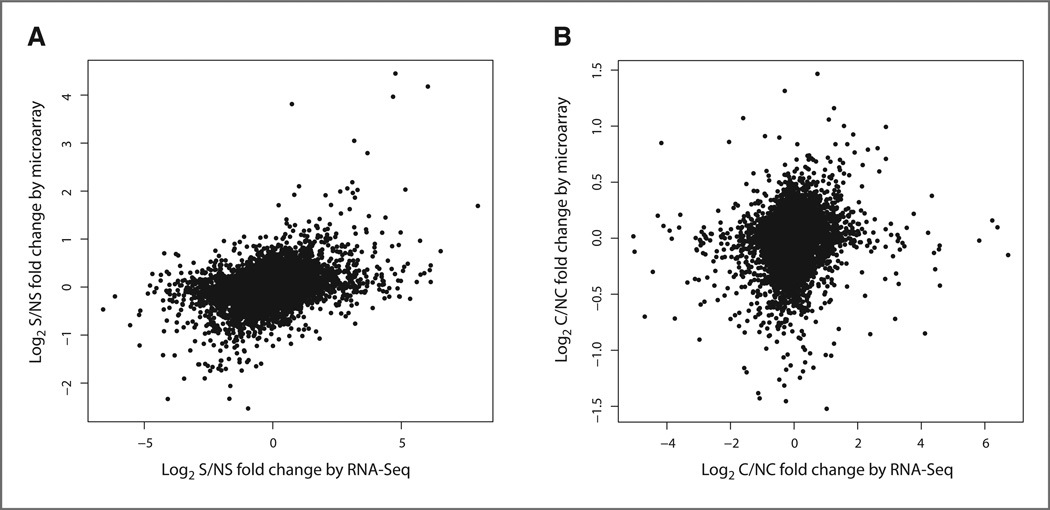
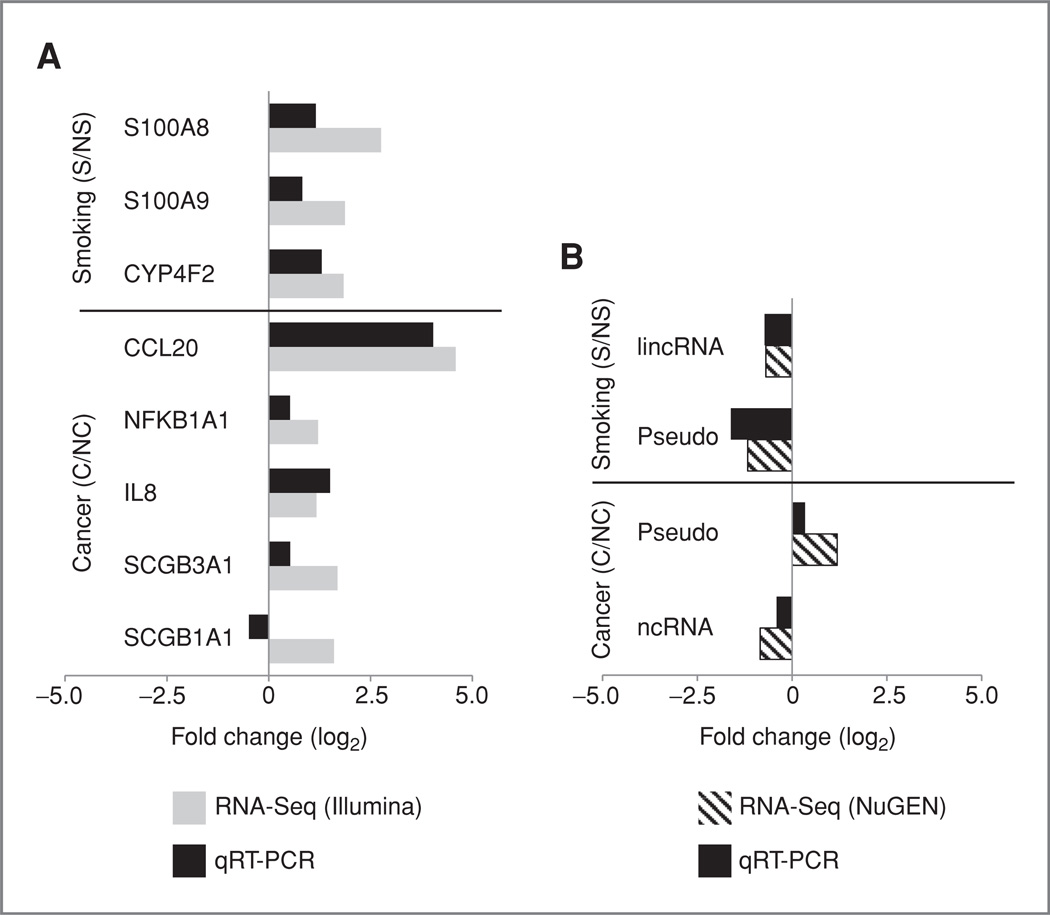
Cigarette smoke creates a molecular field of injury in epithelial cells that line the respiratory tract. We hypothesized that transcriptome sequencing (RNA-Seq) will enhance our understanding of the field of molecular injury in response to tobacco smoke exposure and lung cancer pathogenesis by identifying gene expression differences not interrogated or accurately measured by microarrays. We sequenced the high-molecular-weight fraction of total RNA (>200 nt) from pooled bronchial airway epithelial cell brushings (n = 3 patients per pool) obtained during bronchoscopy from healthy never smoker (NS) and current smoker (S) volunteers and smokers with (C) and without (NC) lung cancer undergoing lung nodule resection surgery. RNA-Seq libraries were prepared using 2 distinct approaches, one capable of capturing non-polyadenylated RNA (the prototype NuGEN Ovation RNA-Seq protocol) and the other designed to measure only polyadenylated RNA (the standard Illumina mRNA-Seq protocol) followed by sequencing generating approximately 29 million 36 nt reads per pool and approximately 22 million 75 nt paired-end reads per pool, respectively. The NuGEN protocol captured additional transcripts not detected by the Illumina protocol at the expense of reduced coverage of polyadenylated transcripts, while longer read lengths and a paired-end sequencing strategy significantly improved the number of reads that could be aligned to the genome. The aligned reads derived from the two complementary protocols were used to define the compendium of genes expressed in the airway epithelium (n = 20,573 genes). Pathways related to the metabolism of xenobiotics by cytochrome P450, retinol metabolism, and oxidoreductase activity were enriched among genes differentially expressed in smokers, whereas chemokine signaling pathways, cytokine-cytokine receptor interactions, and cell adhesion molecules were enriched among genes differentially expressed in smokers with lung cancer. There was a significant correlation between the RNA-Seq gene expression data and Affymetrix microarray data generated from the same samples (P < 0.001); however, the RNA-Seq data detected additional smoking- and cancer-related transcripts whose expression was were either not interrogated by or was not found to be significantly altered when using microarrays, including smoking-related changes in the inflammatory genes S100A8 and S100A9 and cancer-related changes in MUC5AC and secretoglobin (SCGB3A1). Quantitative real-time PCR confirmed differential expression of select genes and non-coding RNAs within individual samples. These results demonstrate that transcriptome sequencing has the potential to provide new insights into the biology of the airway field of injury associated with smoking and lung cancer. The measurement of both coding and non-coding transcripts by RNA-Seq has the potential to help elucidate mechanisms of response to tobacco smoke and to identify additional biomarkers of lung cancer risk and novel targets for chemoprevention.


Conflict of interest statement

Disclosure of Potential Conflicts of Interest

A. Spira and M. Lenburg own equity in and are consultants to Allegro Diagnostics, Inc.

Figures

Figure 1
Figure 1
Study design and goals. A, airway epithelial cells were obtained from 3 never smoker (NS) and 3 current smoker (S) volunteers. The high molecular weight (MW) RNA fraction was isolated from each sample and processed and hybridized to Affymetrix Exon 1.0 ST microarrays (green). Equal amounts of RNA from each sample were then pooled within the NS and S groups. Gene expression was assayed using the standard Illumina RNA-Seq protocol on the Illumina GAIIX sequencer generating 75 nt PE reads (gray) or the prototype NuGEN Ovation RNA-Seq protocol on the Illumina GAII sequencer generating 36 nt SE reads (orange). The same study design was used for the smokers without (NC) and with (C) lung cancer with the exception that RNA from only 2 of the 3 C samples was processed and hybridized to Affymetrix HGU133A 2.0 microarrays (yellow). B, chart displaying the various study goals (y-axis) and the technology and protocol used to accomplish each goal (x-axis), blue boxes indicate which technology and protocol were used to accomplish each goal. Samples were processed and hybridized to microarrays or sequenced using either the NuGEN library preparation protocol (36 nt SE reads) or the Illumina library preparation protocol (75 nt PE reads). The samples processed using the Illumina protocol were analyzed in 3 different ways: to compare library preparation protocols, the 75 nt reads were trimmed to 36 nt and each read of the pair was aligned separately, to compare sequencing length the 75 nt reads were trimmed to 36 nt and each read of the pair was aligned separately, and to compare sequencing type the 75 nt reads aligned separately were compared with the 75 nt reads aligned as a pair.
Figure 2
Figure 2
Read alignment statistics. A, the percentage of reads that align to a unique genomic location (asterisk) and the percentage of reads that span splice junctions (open circle; y-axis) versus the sequencing type (x-axis). The sequencing types are as follows: 36 nt NuGEN SE, 36 nt SE reads generated using the NuGEN protocol (n = 4); 36 nt IIIumina SE, 75 nt PE reads generated using the Illumina protocol were trimmed to 36 nt and each read of the pair was aligned separately (n = 8); 75 nt Illumina SE, each pair of the 75 nt PE reads generated using the Illumina protocol were aligned separately (n = 8); 75 nt Illumina PE, 75 nt PE reads generated using the Illumina protocol and aligned as pairs. For the 75 nt Illumina PE sequencing type, the percentage of uniquely aligned reads (asterisk) contains both reads that align as a pair (black triangle) and reads for which only one read in the pair aligned (open triangle). B, the percentage of reads aligning with zero mismatches (black), 1 mismatch (dark gray), or 2 mismatches (light gray) on y-axis versus sequencing type on x-axis.
Figure 3
Figure 3
The airway transcriptome. A, pie chart of genes detected as present in the airway when the samples were processed using the NuGEN (NG) protocol only (blue), using the Illumina (IL) protocol only (red), or by both protocols (green). B, the correlation between read counts (fifth-root transformed) for genes detected as present by both protocols (Illumina y-axis; NuGEN x-axis) across all 4 samples (NS, S, NC, and C), r = 0.59 and P < 0.001. Light green dots represent protein-coding genes and dark green dots represent nonprotein-coding genes as designated in Ensembl annotation. The least squares ine is shown in black (y = 1.57×). C, the distribution of Ensembl-designated gene biotypes for each of the 3 airway transcriptome categories defined in A.
Figure 4
Figure 4
Read coverage plots of selected genes. For each plot, the reads normalized by the total number of reads (reads per million) are displayed on they-axis and the genomic coordinates are displayed on the x-axis. Within each group (S vs. NS and C vs. NC), the sample with higher expression is shown in black and the sample with lower expression is shown in gray. A, SCN3B (sodium channel, voltage-gated, type III, beta), reads from samples processed using the NuGEN protocol are represented in the top 4 panels and reads from samples processed using the Illumina protocol are represented in the bottom 4 panels. B, MUC5AC (mucin 5AC), reads from samples processed using the Illumina protocol are shown.
Figure 5
Figure 5
Correlation between RNA-Seq and microarray-detected expression differences between the NS and S samples. A, the log2 fold change between the S and NS samples on the Affymetrix Exon 1.0 ST microarray (y-axis) versus the log2 fold change between the RPKM values for the S sample divided by the RPKM values for the NS sample (y-axis). The fold changes between the platforms are significantly correlated (r = 0.36, P < 0.001) across genes measured by both platforms and genes with a non-zero RPKM in the NS and S samples (n = 17,005). B, the log2 fold change between the C and NC samples on the Affymetrix HGU133A 2.0 microarray (y-axis) versus the log2 fold change between the RPKM values for the C sample divided by the RPKM values for the NC sample (y-axis). The fold changes between the platforms are significantly correlated (r = 0.16, P < 0.001) across genes measured by both platforms and genes with a non-zero RPKM in the NC and C samples (n = 9,308).
Figure 6
Figure 6
Correlation of differential expression between RNA-Seq and qRT-PCR. Genes and transcripts were selected as differentially expressed by RNA-Seq. A, log2 fold change (S/NS or C/NC; x-axis) derived on the basis of samples processed using the Illumina protocol (gray) versus log2 fold change derived on the basis of qRT-PCR results wherein expression values for each phenotype (NS, S, NC, or C) are averaged from 3 samples (black). B. Same as A, except the log2 fold change is derived on the basis of samples processed using the NuGEN protocol (diagonal lines).

References

    1. Shields PG. Molecular epidemiology of lung cancer. Ann Oncol. 1999;10(Suppl 5):S7–S11. - PubMed
    1. Spira A, Beane J, Shah V, Liu G, Schembri F, Yang X, et al. Effects of cigarette smoke on the human airway epithelial cell transcriptome. Proc Natl Acad Sci U S A. 2004;101:10143–10148. - PMC - PubMed
    1. Miyazu YM, Miyazawa T, Hiyama K, Kurimoto N, Iwamoto Y, Matsuura H, et al. Telomerase expression in noncancerous bronchial epithelia is a possible marker of early development of lung cancer. Cancer Res. 2005;65:9623–9627. - PubMed
    1. Guo M, House MG, Hooker C, Han Y, Heath E, Gabrielson E, et al. Promoter hypermethylation of resected bronchial margins: a field defect of changes? Clin Cancer Res. 2004;10:5131–5136. - PubMed
    1. Franklin WA, Gazdar AF, Haney J, Wistuba II, La Rosa FG, Kennedy T, et al. Widely dispersed p53 mutation in respiratory epithelium. A novel mechanism for field carcinogenesis. J Clin Invest. 1997;100:2133–2137. - PMC - PubMed

Publication types

MeSH terms