. 2011 Jul 29;286(30):26794-805.
doi: 10.1074/jbc.M111.250985. Epub 2011 Jun 2.

Conditional inactivation of the CXCR4 receptor in osteoprecursors reduces postnatal bone formation due to impaired osteoblast development

Affiliations

Conditional inactivation of the CXCR4 receptor in osteoprecursors reduces postnatal bone formation due to impaired osteoblast development

Wei Zhu et al. J Biol Chem. .

Abstract

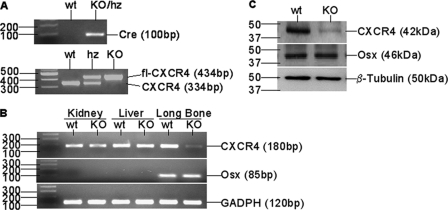
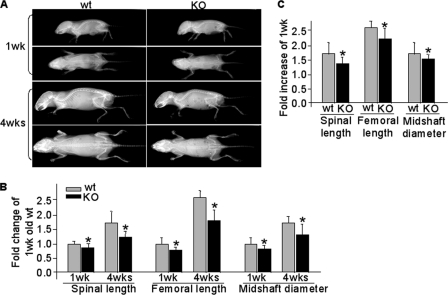
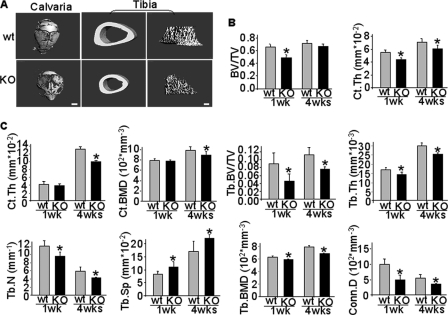
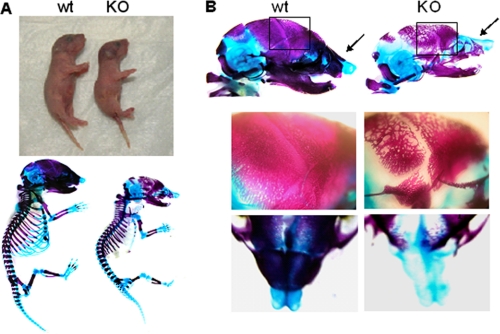
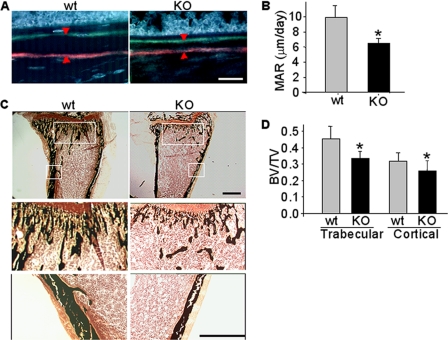
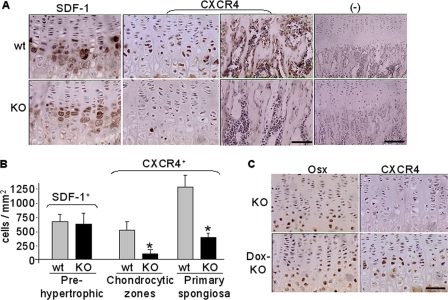
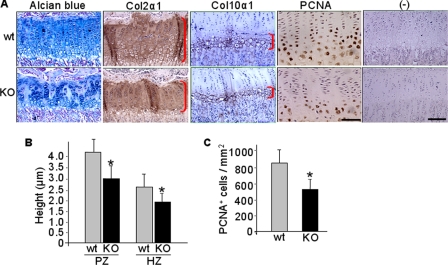
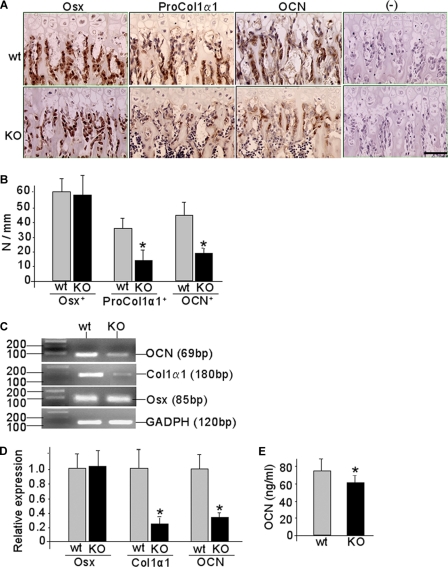
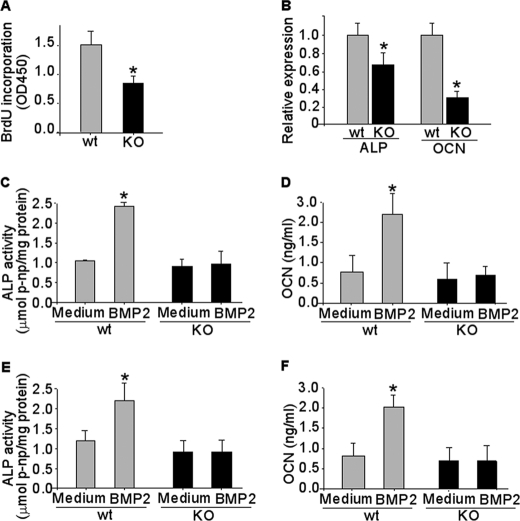
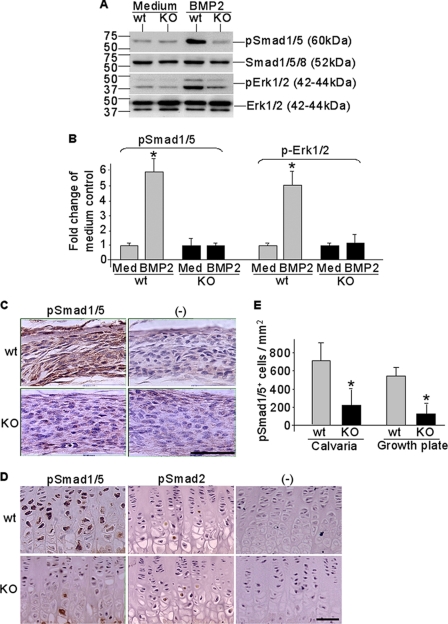
Cysteine (C)-X-C motif chemokine receptor 4 (CXCR4), the primary receptor for stromal cell-derived factor-1 (SDF-1), is involved in bone morphogenic protein 2 (BMP2)-induced osteogenic differentiation of mesenchymal progenitors. To target the in vivo function of CXCR4 in bone and explore the underlying mechanisms, we conditionally inactivated CXCR4 in osteoprecursors by crossing osterix (Osx)-Cre mice with floxed CXCR4 (CXCR4(fl/fl)) mice to generate knock-outs with CXCR4 deletion driven by the Osx promoter (Osx::CXCR4(fl/fl)). The Cre-mediated excision of CXCR4 occurred exclusively in bone of Osx::CXCR4(fl/fl) mice. When compared with littermate controls, Osx::CXCR4(fl/fl) mice developed smaller osteopenic skeletons as evidenced by reduced trabecular and cortical bone mass, lower bone mineral density, and a slower mineral apposition rate. In addition, Osx::CXCR4(fl/fl) mice displayed chondrocyte disorganization in the epiphyseal growth plate associated with decreased proliferation and collagen matrix syntheses. Moreover, mature osteoblast-related expression of type I collagen α1 and osteocalcin was reduced in bone of Osx::CXCR4(fl/fl) mice versus controls, suggesting that CXCR4 deficiency results in arrested osteoblast progression. Primary cultures for osteoblastic cells derived from Osx::CXCR4(fl/fl) mice also showed decreased proliferation and impaired osteoblast differentiation in response to BMP2 or BMP6 stimulation, and suppressed activation of intracellular BMP receptor-regulated Smads (R-Smads) and Erk1/2 was identified in CXCR4-deficient cells and bone tissues. These findings provide the first in vivo evidence that CXCR4 functions in postnatal bone development by regulating osteoblast development in cooperation with BMP signaling. Thus, CXCR4 acts as an endogenous signaling component necessary for bone formation.


Figures

FIGURE 1.
FIGURE 1.
Bone specific-deletion of CXCR4 in Osx::CXCR4fl/fl mice. A, representative genotyping PCR for Cre transgene and floxed (fl) Cxcr4 relative to wild type Cxcr4 in Osx::CXCR4fl/fl mice (KO), littermates heterozygous (hz) for Cre and floxed Cxcr4 (Osx-Cre;CXCR4fl/+), and Cre-null littermates (CXCR4fl/+ and CXCR4fl/fl), which were equivalent to wild type (WT) controls. B, RT-PCR detection of Cxcr4, Osx, and Gapdh control in kidneys, livers, and long bones (femora and tibiae) derived from newborn (days 1–3 after birth) KO and WT mice. C, Western blotting for basal expression of CXCR4, Osx, and β-tubulin control in calvaria cells derived from newborn KO or WT mice. Cells were pooled from n = 3 WT or KO mice; experiments were repeated twice using mice from different litters.
FIGURE 2.
FIGURE 2.
Reduced skeletal size in Osx::CXCR4fl/fl mice. A, representative x-ray lateral and anterior-posterior view radiographs of Osx::CXCR4fl/fl (KO) mice and Cre-null littermate controls equivalent to WT at 1 and 4 weeks old; all were females. B, -fold changes of skeletal size parameters when compared with WT control at 1 week old, which was set as 1. C, -fold increases in skeletal size parameters at 4 weeks versus those of 1 week in WT or KO mice. n = 5 female WT or KO mice at 1 or 4 weeks old. Measurements are presented as mean ± S.D. *, p < 0.05 versus 1-week-old WT (B) or versus respective 1-week-old mice (C).
FIGURE 3.
FIGURE 3.
Structural alterations in Osx::CXCR4fl/fl mice. A, representative μCT images of entire parietal calvariae (1-week-old females) and tibia cortical and trabecular bone (4-week-old females) in Osx::CXCR4fl/fl mice (KO) and Cre-null littermate controls (WT). The scale bar equals 1 mm in calvariae or 100 μm in tibiae. B, quantitative μCT analysis of calvaria cortical BV/TV and Ct.Th. C, quantitative μCT analysis of cortical and trabecular structure on 200 microtomographic slices (2.1 mm) at the proximal tibia. Measurements were Ct.Th, cortical (Ct.) BMD, trabecular (Tb.) BV/TV, trabecular thickness (Tb.Th), trabecular number (Tb.N), trabecular separation (Tb.Sp), trabecular BMD, and connective tissue density (Conn.D). n = 5 female WT or KO mice at 1 or 4 weeks old. Measurements are presented as mean ± S.D. *, p < 0.05 versus respective WT control.
FIGURE 4.
FIGURE 4.
Prenatal skeletal changes in Osx::CXCR4fl/fl mice. A, representative images of newborn (day 1) Osx::CXCR4fl/fl mice (KO) and Cre-null littermates used as WT controls (upper panel) and Alcian blue/Alizarin red staining of E18.5 embryos (lower panel). B, Alcian blue/Alizarin red staining of entire heads (upper panel) and amplified regions of calvaria (framed areas) and nose (indicated by arrows) of E18.5 embryos (lower panels). WT and KO from two different litters were observed.
FIGURE 5.
FIGURE 5.
Decreased MAR in Osx::CXCR4fl/fl mice. A, double fluorochrome-labeling in tibiae of Osx::CXCR4fl/fl mice (KO) and Cre-null littermate controls (WT) by xylenol orange (orange-red) and tetracycline (green) in a 4-day time interval. The scale bar equals 100 μm. B, the distance between two fluorochrome-labeled mineralization fronts (indicated by arrowheads in A) at the midshaft of tibia was quantified using OsteoII software (Bioquant). The MAR was calculated by dividing the measured distance by the time interval. C, von Kossa staining of the fluorochrome-labeled tibiae (upper panel; scale bar equals 500 μm). Mineralized trabecular or cortical bone (amplification of framed areas) is stained black (lower panels; scale bar equals 500 μm). D, histomorphometric analysis for mineralized bone in von Kossa-stained tibiae. The trabecular BV/TV was determined by dividing the area of mineralized trabecular bone by the total area from the epiphyseal growth plate to the midshaft of tibia. The cortical BV/TV was determined at the midshaft of tibia by dividing the cortical thickness by the total width of tibia. Five measurements per section for three consecutive sections were taken to average each sample. n = 5 (females; 2 weeks old) WT or KO mice. Measurements are presented as mean ± S.D. *, p < 0.05 versus WT control.
FIGURE 6.
FIGURE 6.
Decreased CXCR4 expression in epiphyseal growth plate of Osx::CXCR4fl/fl mice (KO) versus Cre-null littermate controls (WT). A, immunohistochemistry for SDF-1 expression in pre- and hypertrophic chondrocytes and CXCR4 expression in chondrocytic cells and in primary spongiosa (scale bar equals 50 μm). Negative (−) controls used isotype-matched control antibodies (scale bar equals 100 μm). B, histomorphometric analysis (OsteoII software, Bioquant) for the number of cells positive for SDF-1 or CXCR4 expression. The number of cells positive for SDF-1 immunostaining was measured from the pre- to hypertrophic zones. The number of cells positive for CXCR4 was measured in three regions (each at 185 × 250 μm2) in the middle of the growth plate or the primary spongiosa. Five measurements per section for three consecutive sections were taken to average each sample. C, immunohistochemistry for Osx and CXCR4 expression in growth plate of KO mice and control KO mice that were treated with doxycycline (200 μg/ml in drinking water) after birth (Dox-KO). n = 5 (three females and two males; 4 weeks old) WT or KO mice. Measurements are presented as mean ± S.D. *, p < 0.05 versus respective WT control.
FIGURE 7.
FIGURE 7.
Epiphyseal growth plate disorganization in tibiae of Osx::CXCR4fl/fl mice. A, representative Alcian blue staining; immunohistochemistry for Col2α1, Col10α1, and PCNA; and negative (−) controls using isotype-matched control antibody. The scale bar equals 50 μm in PCNA-stained sections or 100 μm in the rest of the sections. B, histomorphometric analysis (OsteoII, Bioquant) for the height of the proliferative (PZ) and hypertrophic zones (HZ) in the middle of the growth plate (indicated by right brackets in A). C, histomorphometric measurements for the number of PCNA-stained cells from the proliferative to hypertrophic zones. Five measurements per section for three consecutive sections were taken to average each sample. n = 5 (three females and two males; 4 weeks old) WT or KO mice. Measurements are presented as mean ± S.D. *, p < 0.05 versus WT control.
FIGURE 8.
FIGURE 8.
Arrested osteoblast progression in Osx::CXCR4fl/fl mice. A, representative immunohistochemistry for Osx, ProCol1α1, and OCN in the primary spongiosa of Osx::CXCR4fl/fl (KO) mice and Cre-null littermate controls (WT). Isotype-matched control IgGs were used in negative (−) controls. The scale bar equals 50 μm. B, histomorphometric analysis (OsteoII, Bioquant) for the number of positively stained cells per bone surface in three regions (each at 185 × 250 μm2) in the middle of the primary spongiosa. Five measurements per section for three consecutive sections were taken to average each sample. n = 5 (three females and two males; 4 weeks old) WT or KO mice. C, representative RT-PCR detection for Osx, Col1α1, Ocn, and Gapdh control in long bones derived from newborn (days 1–3 after birth) KO or WT mice. D, qPCR quantification of the expression level of Osx, Col1α1, and Ocn relative to Gapdh control in long bones derived from newborn KO or WT mice. n = 5 WT or KO. E, serum OCN level in KO mouse versus WT controls. n = 5 (three females and two males; 12 weeks old). All measurements are presented as mean ± S.D. *, p < 0.05 versus WT control.
FIGURE 9.
FIGURE 9.
CXCR4 deficiency inhibits cell proliferation and osteoblast differentiation induced by BMP. Primary osteoblastic cells were derived from newborn (days 1–3 after birth) calvariae of Osx::CXCR4fl/fl (KO) mice and Cre-null littermate controls (WT). A, BrdU incorporation for 6 h in WT or KO calvaria cells. B, qPCR measurements of base-line mRNA levels of Alp and Ocn relative to Gapdh control in calvaria cells of WT or KO mice. C–F, calvaria cells were stimulated with rhBMP2 (C and D) or rhBMP6 (E and F) protein at 100 ng/ml for 4 or 7 days or were maintained in culture medium without any stimulation as controls. ALP activities were measured in cell lysates and normalized to the level of total cellular protein. OCN levels were measured in cell medium using ELISA. Cultures were pooled from calvariae of n = 3 WT or KO mice, and triplicate wells of cells were used for each sample. Experiments were repeated twice using mice from two different litters. Measurements are expressed as mean ± S.D. *, p < 0.05 versus respective medium-only control.
FIGURE 10.
FIGURE 10.
Impaired BMP signaling in CXCR4-deficient cells and bone tissues. Calvaria osteoblasts were derived from newborn (days 1–3 after birth) Osx::CXCR4fl/fl (KO) mice or Cre-null littermate controls (WT). Cells were stimulated with rhBMP2 at 100 ng/ml for 15 min or were maintained in culture medium (Med) only as controls. A and B, Western detection of Smad1/5 and Erk1/2 phosphorylation relative to unphosphorylated total Smads and Erk (A) and gel image analysis for band intensities of pSmad1/5 and pErk1/2 compared with that of medium-only control cells (B). Cultures were pooled from calvariae of n = 3 WT or KO mice, and triplicate wells of cells were used for each sample. Experiments were repeated twice using mice from two different litters. Measurements are expressed as mean ± S.D. *, p < 0.05 versus respective medium-only control. C–E, immunohistochemistry detection of pSmad1/5 expression in calvaria (C) and pSmad1/5 and pSmad2 expression in tibia growth plate (D) followed by histomorphometric analysis (OsteoII, Bioquant) for the number of positively stained cells in three regions of calvaria (each at 185 × 250 μm2) and from the pre- to hypertrophic zones in the growth plate of tibia (E). Isotype-matched control IgGs were used in negative (−) controls. The scale bar equals 50 μm in calvaria or growth plate sections. Five measurements per section for three consecutive sections were taken to average each sample. n = 5 (three females and two males; 4 weeks old) WT or KO. All measurements are expressed as mean ± S.D. *, p < 0.05 versus respective WT control.

References

    1. Shirozu M., Nakano T., Inazawa J., Tashiro K., Tada H., Shinohara T., Honjo T. (1995) Genomics 28, 495–500 - PubMed
    1. D'Apuzzo M., Rolink A., Loetscher M., Hoxie J. A., Clark-Lewis I., Melchers F., Baggiolini M., Moser B. (1997) Eur. J. Immunol. 27, 1788–1793 - PubMed
    1. Yu L., Cecil J., Peng S. B., Schrementi J., Kovacevic S., Paul D., Su E. W., Wang J. (2006) Gene 374, 174–179 - PubMed
    1. Zlotnik A., Yoshie O. (2000) Immunity 12, 121–127 - PubMed
    1. Nagasawa T., Hirota S., Tachibana K., Takakura N., Nishikawa S., Kitamura Y., Yoshida N., Kikutani H., Kishimoto T. (1996) Nature 382, 635–638 - PubMed

Publication types

MeSH terms

LinkOut - more resources