Case Reports
. 2011 Jul;22(7):1365-74.
doi: 10.1681/ASN.2010121266. Epub 2011 Jun 2.

Accelerated maturation and abnormal morphology in the preterm neonatal kidney

Affiliations
Case Reports

Accelerated maturation and abnormal morphology in the preterm neonatal kidney

Megan R Sutherland et al. J Am Soc Nephrol. 2011 Jul.

Abstract

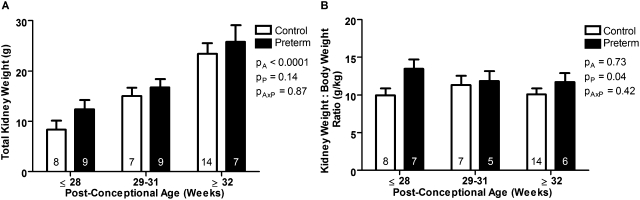
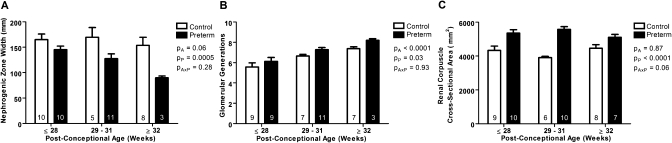
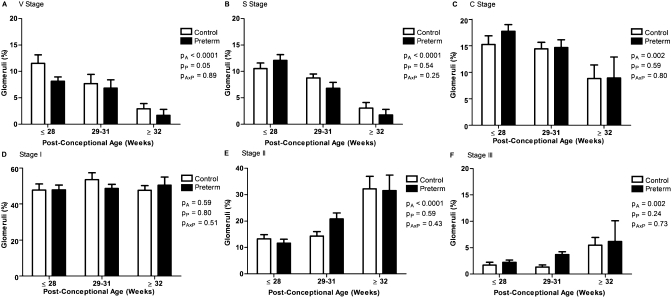
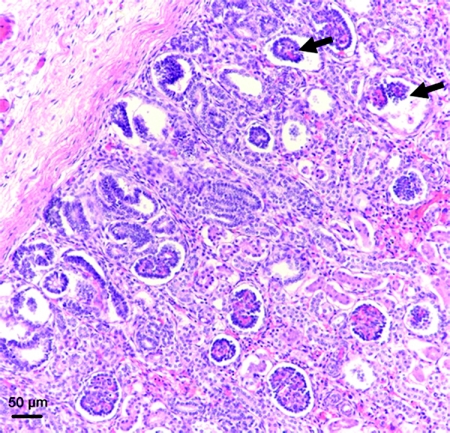
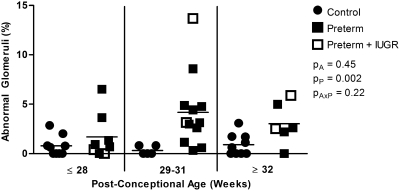
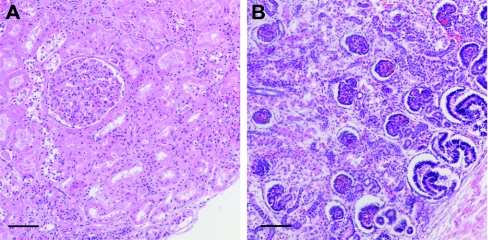
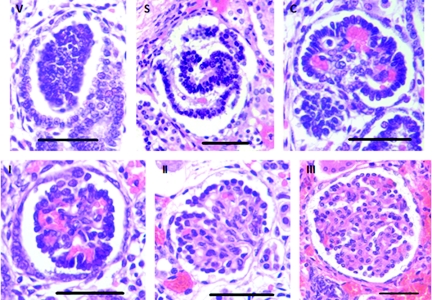
Nephrogenesis is ongoing at the time of birth for the majority of preterm infants, but whether postnatal renal development follows a similar trajectory to normal in utero growth is unknown. Here, we examined tissue collected at autopsy from 28 kidneys from preterm neonates, whose postnatal survival ranged from 2 to 68 days, including 6 that had restricted intrauterine growth. In addition, we examined kidneys from 32 still-born gestational controls. We assessed the width of the nephrogenic zone, number of glomerular generations, cross-sectional area of the renal corpuscle, and glomerular maturity and morphology. Renal maturation accelerated after preterm birth, with an increased number of glomerular generations and a decreased width of the nephrogenic zone in the kidneys of preterm neonates. Of particular concern, compared with gestational controls, preterm kidneys had a greater percentage of morphologically abnormal glomeruli and a significantly larger cross-sectional area of the renal corpuscle, suggestive of renal hyperfiltration. These observations suggest that the preterm kidney may have fewer functional nephrons, thereby increasing vulnerability to impaired renal function in both the early postnatal period and later in life.


Figures

Figure 1.
Figure 1.
Increased kidney-to-body weight ratio in preterm neonates. (A) Total combined kidney weight and (B) kidney weight relative to body weight in gestational controls (white bars) and preterm neonates (black bars), grouped by postconceptional age. The number of neonates in each group is indicated on the bars. Total kidney weight significantly increased with increasing postconceptional age (A). Compared with the gestational controls, the preterm neonates had a significantly increased kidney-to-body weight ratio (B). Bars represent mean ± SEM. PA, postconceptional age; PP, prematurity; PAxP, interaction.
Figure 2.
Figure 2.
Decreased nephrogenic zone width, increased number of glomerular generations, and increased renal corpuscle size in kidneys from preterm neonates. (A) Nephrogenic zone width, (B) glomerular generation number, and (C) mean renal corpuscle cross-sectional area in kidneys from gestational controls (white bars; 6 neonates with completed nephrogenesis were not included in A and B) and preterm neonates (black bars; 4 neonates with completed nephrogenesis were not included in A and B), grouped by postconceptional age. The number of neonates in each group is indicated on the bars. Average nephrogenic zone width was significantly less in preterm neonates compared with gestational controls (A). The number of glomerular generations significantly increased with increasing postconceptional age, and was significantly greater in the preterm neonates compared with the gestational controls (B). Mean renal corpuscle cross-sectional area was significantly larger in the preterm neonates compared with the gestational controls (C). Bars represent mean ± SEM. PA, postconceptional age; PP, prematurity; PAxP, interaction.
Figure 3.
Figure 3.
Percentage of immature V-stage glomeruli is reduced in the kidneys of preterm neonates. The percentage of glomeruli at each stage of maturity, in the gestational control (white bars) and preterm neonates (black bars), grouped by postconceptional age. Control: ≤28 weeks (n = 9), 29 to 31 weeks (n = 5), ≥32 weeks (n = 9); preterm: ≤28 weeks (n = 8), 29 to 31 weeks (n = 12), ≥32 weeks (n = 6). The percentage of glomeruli at stages V (A), S (B), and C (C) significantly decreased with increasing postconceptional age, whereas the percentage of glomeruli at stages II (E) and III (F) significantly increased. There was no change in the percentage of glomeruli at stage I with increasing postconceptional age (D). A significantly lower percentage of V-stage glomeruli were observed in the preterm kidneys compared with the gestational controls (A). Bars represent mean ± SEM. PA, postconceptional age; PP, prematurity; PAxP, interaction.
Figure 4.
Figure 4.
Abnormal glomerular morphology in the kidney of a preterm neonate. Representative photomicrograph depicting abnormal glomeruli, with dilated Bowman's space and shrunken tuft (arrows), in the outer cortex of a preterm neonatal kidney.
Figure 5.
Figure 5.
Increased percentage of morphologically abnormal glomeruli in kidneys from preterm neonates. The percentage of abnormal glomeruli in the kidneys of gestational controls and preterm neonates, grouped by postconceptional age. Control: ≤28 weeks (n = 9), 29 to 31 weeks (n = 5), ≥32 weeks (n = 9); preterm: ≤28 weeks (n = 8), 29 to 31 weeks (n = 12), ≥32 weeks (n = 6). The percentage of abnormal glomeruli was significantly increased in the preterm group compared with the gestational controls. PA, postconceptional age; PP, prematurity; PAxP, interaction.
Figure 6.
Figure 6.
Larger mean renal corpuscle area in a preterm neonate with oligonephronia. Representative photomicrographs of the outer renal cortex of (A) one preterm neonate with oligonephronia (postconceptional age 30.7 weeks) and (B) one preterm neonate with the appearance of normal renal development (postconceptional age 30.0 weeks). In the neonate with oligonephronia, nephrogenesis is complete, with the single visible glomerulus at stage III of development. In contrast, the kidney of the preterm neonate in (B) exhibits an active nephrogenic zone, and the numerous outer cortical glomeruli are in S-stage, C-stage, and stage I of development. Furthermore, mean renal corpuscle area was significantly larger in the neonate with oligonephronia (A). Bar represents 100 μm.
Figure 7.
Figure 7.
Stages of glomerular maturity in the developing human kidney. The following criteria for the assessment of glomerular maturation are based on Naruse et al. and Thony et al. (V) Vesicle: Condensate of mesenchymal cells formed adjacent to a ureteric branch tip in the outer nephrogenic zone. (S) Comma-shape and S-shape: Elongated vesicle develops proximal and distal clefts to form a comma-shaped followed by an S-shaped body. (C) Capillary loop: Cells of the lower limb of the S-shaped body differentiate to form an immature, crescent-shaped glomerulus. (I) Stage I: Fully formed glomeruli with at least half of the glomerular tuft lined with dark-staining epithelial cells (podocytes). The inner tuft is a dense collection of cells. (II) Stage II: Less than half the circumference of the tuft is lined with podocytes, with at least five adjoining. The inner tuft may exhibit some lobulation. (III) Stage III: Glomeruli with no podocyte layer surrounding the tuft, and an inner tuft showing lobulation and open capillary loops. There is also evidence of flattening of the parietal epithelial cells lining Bowman's capsule. Bar represents 50 μm.

Similar articles

Cited by

References

    1. Tracy S, Tracy M, Dean J, Laws P, Sullivan E: Spontaneous preterm birth of liveborn infants in women at low risk in Australia over 10 years: A population-based study. BJOG 114: 731–735, 2007 - PubMed
    1. Martin J, Hamilton B, Sutton P, Ventura S, Menacher F, Kirmeyer S: Births: Final data for 2004. Natl Vital Stat Rep 55: 1–101, 2006 - PubMed
    1. Fellman V, Hellstrom-Westas L, Norman M, Westgren M, Kallen K, Lagercrantz H, Marsal K, Serenius F, Wennergren M: One-year survival of extremely preterm infants after active perinatal care in Sweden. JAMA 301: 2225–2233, 2009 - PubMed
    1. Goldenberg R, Culhane J, Iams J, Romero R: Epidemiology and causes of preterm birth. Lancet 371: 75–84, 2008 - PMC - PubMed
    1. McCormick MC: The contribution of low birth weight to infant mortality and childhood morbidity. N Engl J Med 312: 82–90, 1985 - PubMed

Publication types