

Downregulation of Pdcd4 by mir-21 facilitates glioblastoma proliferation in vivo
- PMID: 21636706
- PMCID: PMC3107097
- DOI: 10.1093/neuonc/nor033
Downregulation of Pdcd4 by mir-21 facilitates glioblastoma proliferation in vivo
Abstract
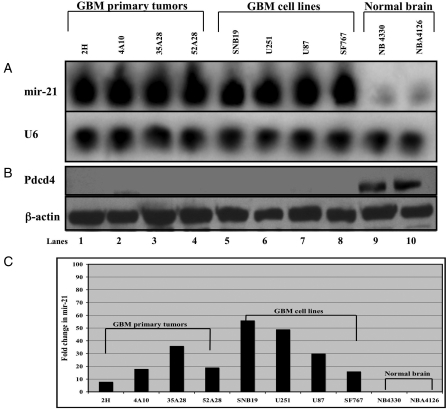
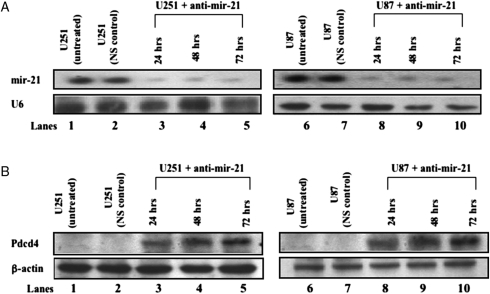
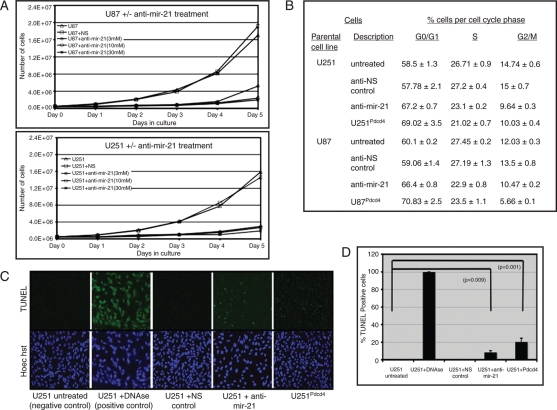
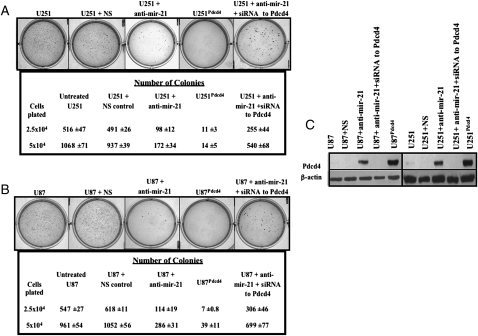
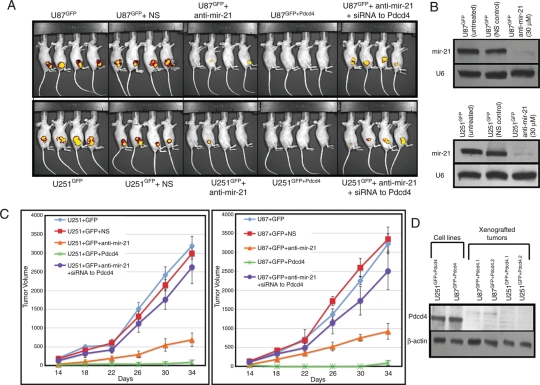
MicroRNAs (miRNAs) are small, noncoding RNAs that play a critical role in developmental and physiological processes and are implicated in the pathogenesis of several human diseases, including cancer. They function by regulating target gene expression post-transcriptionally. In this study, we examined the role of oncogenic mir-21 in the pathogenesis of glioblastoma, the most aggressive form of primary brain tumor. We have previously reported that mir-21 is expressed at higher levels in primary glioblastoma-tissue and glioblastoma-derived cell lines than in normal brain tissue. We demonstrate that downregulation of mir-21 in glioblastoma-derived cell lines results in increased expression of its target, programmed cell death 4 (Pdcd4), a known tumor-suppressor gene. In addition, our data indicate that either downregulation of mir-21 or overexpression of its target, Pdcd4, in glioblastoma-derived cell lines leads to decreased proliferation, increased apoptosis, and decreased colony formation in soft agar. Using a glioblastoma xenograft model in immune-deficient nude mice, we observe that glioblastoma-derived cell lines in which mir-21 levels are downregulated or Pdcd4 is over-expressed exhibit decreased tumor formation and growth. Significantly, tumors grow when the glioblastoma-derived cell lines are transfected with anti-mir-21 and siRNA to Pdcd4, confirming that the tumor growth is specifically regulated by Pdcd4. These critical in vivo findings demonstrate an important functional linkage between mir-21 and Pdcd4 and further elucidate the molecular mechanisms by which the known high level of mir-21 expression in glioblastoma can attribute to tumorigenesis--namely, inhibition of Pdcd4 and its tumor-suppressive functions.
Figures
Similar articles
-
Targeting strategies on miRNA-21 and PDCD4 for glioblastoma.Arch Biochem Biophys. 2015 Aug 15;580:64-74. doi: 10.1016/j.abb.2015.07.001. Epub 2015 Jul 2. Arch Biochem Biophys. 2015. PMID: 26142886 Review.
-
MicroRNA-21 (miR-21) post-transcriptionally downregulates tumor suppressor PDCD4 and promotes cell transformation, proliferation, and metastasis in renal cell carcinoma.Cell Physiol Biochem. 2014;33(6):1631-42. doi: 10.1159/000362946. Epub 2014 May 16. Cell Physiol Biochem. 2014. PMID: 24902663
-
MicroRNA-21 down-regulates the expression of tumor suppressor PDCD4 in human glioblastoma cell T98G.Cancer Lett. 2008 Dec 18;272(2):197-205. doi: 10.1016/j.canlet.2008.06.034. Epub 2008 Nov 13. Cancer Lett. 2008. PMID: 19013014
-
A Feedback Loop between MicroRNA 155 (miR-155), Programmed Cell Death 4, and Activation Protein 1 Modulates the Expression of miR-155 and Tumorigenesis in Tongue Cancer.Mol Cell Biol. 2019 Mar 1;39(6):e00410-18. doi: 10.1128/MCB.00410-18. Print 2019 Mar 15. Mol Cell Biol. 2019. PMID: 30617160 Free PMC article.
-
Unraveling the impact of miR-21 on apoptosis regulation in glioblastoma.Pathol Res Pract. 2024 Feb;254:155121. doi: 10.1016/j.prp.2024.155121. Epub 2024 Jan 10. Pathol Res Pract. 2024. PMID: 38262269 Review.
Cited by
-
Feedback regulations of miR-21 and MAPKs via Pdcd4 and Spry1 are involved in arsenite-induced cell malignant transformation.PLoS One. 2013;8(3):e57652. doi: 10.1371/journal.pone.0057652. Epub 2013 Mar 1. PLoS One. 2013. PMID: 23469214 Free PMC article.
-
Deep sequencing reveals predominant expression of miR-21 amongst the small non-coding RNAs in retinal microvascular endothelial cells.J Cell Biochem. 2012 Jun;113(6):2098-111. doi: 10.1002/jcb.24084. J Cell Biochem. 2012. PMID: 22298343 Free PMC article.
-
MiR-21 down-regulation suppresses cell growth, invasion and induces cell apoptosis by targeting FASL, TIMP3, and RECK genes in esophageal carcinoma.Dig Dis Sci. 2013 Jul;58(7):1863-70. doi: 10.1007/s10620-013-2612-2. Epub 2013 Mar 17. Dig Dis Sci. 2013. PMID: 23504349
-
Host Non-Coding RNA Regulates Influenza A Virus Replication.Viruses. 2021 Dec 29;14(1):51. doi: 10.3390/v14010051. Viruses. 2021. PMID: 35062254 Free PMC article. Review.
-
PDCD4 inhibits lung tumorigenesis by the suppressing p62-Nrf2 signaling pathway and upregulating Keap1 expression.Am J Cancer Res. 2020 Feb 1;10(2):424-439. eCollection 2020. Am J Cancer Res. 2020. PMID: 32195018 Free PMC article.
References
-
- Standart N, Jackson RJ. MicroRNAs repress translation of m7Gppp-capped target mRNAs in vitro by inhibiting initiation and promoting deadenylation. Genes Dev. 2007;21:1975–1982. doi:10.1101/gad.1591507. - DOI - PubMed
-
- de Moor CH, Meijer H, Lissenden S. Mechanisms of translational control by the 3′ UTR in development and differentiation. Semin Cell Dev Biol. 2005;16:49–58. doi:10.1016/j.semcdb.2004.11.007. - DOI - PubMed
-
- Zhang B, Wang Q, Pan X. MicroRNAs and their regulatory roles in animals and plants. J Cell Physiol. 2007;210:279–289. doi:10.1002/jcp.20869. - DOI - PubMed
-
- Miska EA. How microRNAs control cell division, differentiation and death. Curr Opin Genet Dev. 2005;15:563–568. doi:10.1016/j.gde.2005.08.005. - DOI - PubMed
-
- Sevignani C, Calin GA, Siracusa LD, Croce CM. Mammalian microRNAs: a small world for fine-tuning gene expression. Mamm Genome. 2006;17:189–202. doi:10.1007/s00335-005-0066-3. - DOI - PMC - PubMed
Publication types
MeSH terms
Substances
LinkOut - more resources
Full Text Sources
Other Literature Sources
Medical
