. 2011 Aug;156(4):1740-53.
doi: 10.1104/pp.111.174466. Epub 2011 Jun 2.

Extracellular nucleotides and apyrases regulate stomatal aperture in Arabidopsis

Affiliations

Extracellular nucleotides and apyrases regulate stomatal aperture in Arabidopsis

Greg Clark et al. Plant Physiol. 2011 Aug.

Abstract

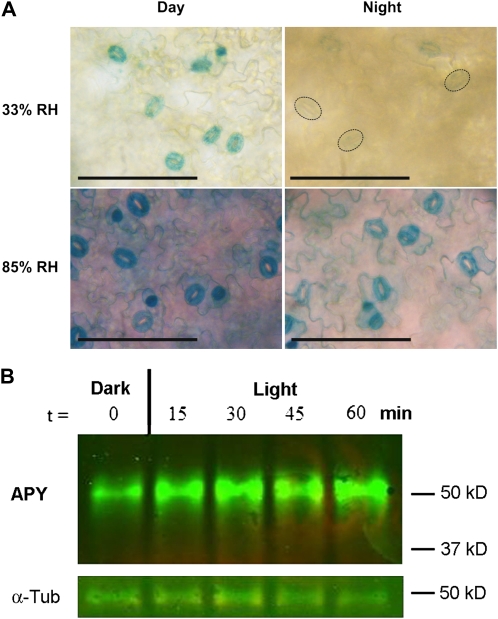
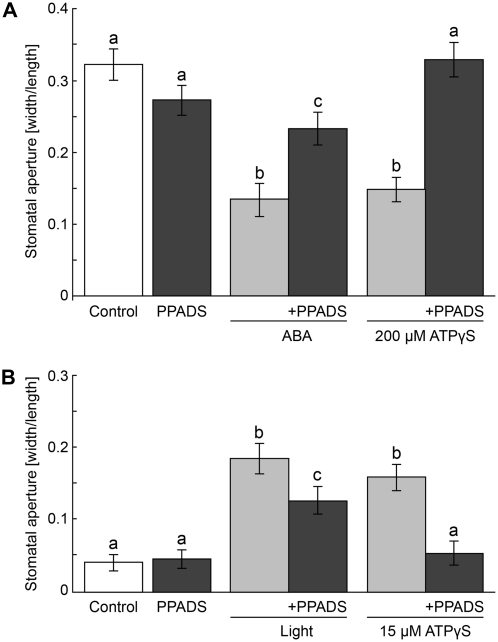
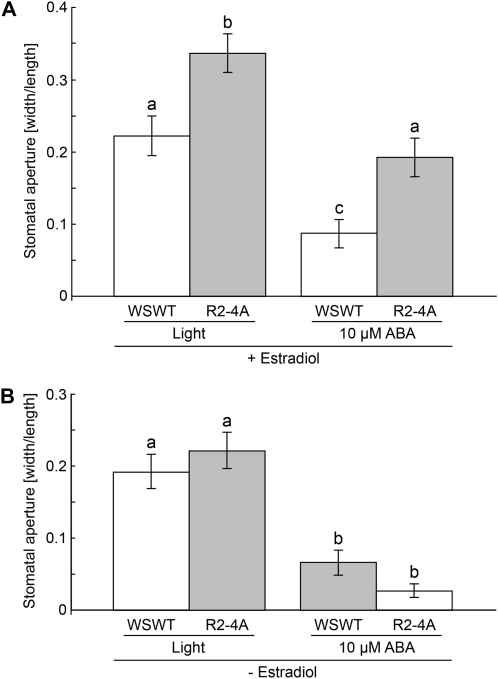
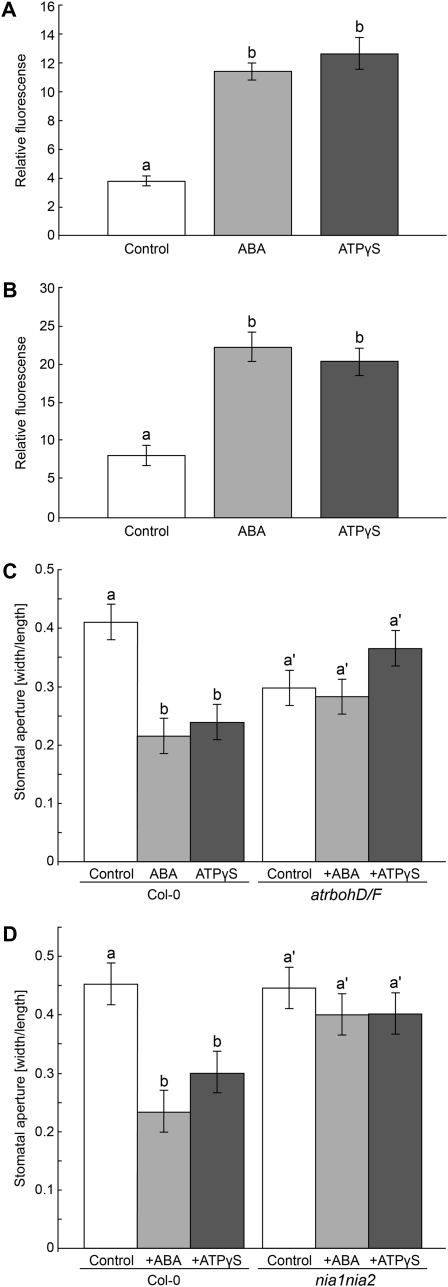
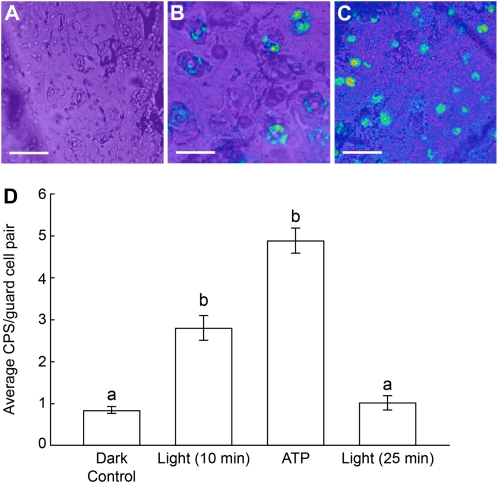
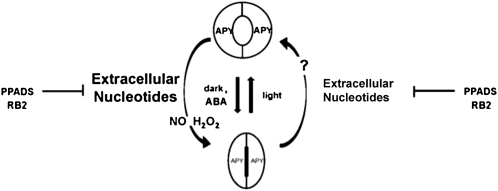
This study investigates the role of extracellular nucleotides and apyrase enzymes in regulating stomatal aperture. Prior data indicate that the expression of two apyrases in Arabidopsis (Arabidopsis thaliana), APY1 and APY2, is strongly correlated with cell growth and secretory activity. Both are expressed strongly in guard cell protoplasts, as determined by reverse transcription-polymerase chain reaction and immunoblot analyses. Promoter activity assays for APY1 and APY2 show that expression of both apyrases correlates with conditions that favor stomatal opening. Correspondingly, immunoblot data indicate that APY expression in guard cell protoplasts rises quickly when these cells are moved from darkness into light. Both short-term inhibition of ectoapyrase activity by polyclonal antibodies and long-term suppression of APY1 and APY2 transcript levels significantly disrupt normal stomatal behavior in light. Stomatal aperture shows a biphasic response to applied adenosine 5'-[γ-thio]triphosphate (ATPγS) or adenosine 5'-[β-thio] diphosphate, with lower concentrations inducing stomatal opening and higher concentrations inducing closure. Equivalent concentrations of adenosine 5'-O-thiomonophosphate have no effect on aperture. Two mammalian purinoceptor inhibitors block ATPγS- and adenosine 5'-[β-thio] diphosphate-induced opening and closing and also partially block the ability of abscisic acid to induce stomatal closure and of light to induce stomatal opening. Treatment of epidermal peels with ATPγS induces increased levels of nitric oxide and reactive oxygen species, and genetically suppressing the synthesis of these agents blocks the effects of nucleotides on stomatal aperture. A luciferase assay indicates that treatments that induce either the closing or opening of stomates also induce the release of ATP from guard cells. These data favor the novel conclusion that ectoapyrases and extracellular nucleotides play key roles in regulating stomatal functions.


Figures

Figure 1.
Figure 1.
Apyrase expression is enriched in preparations of guard cell protoplasts compared with extracts of whole leaves. A, As assayed by RT-PCR, APY1 and APY2 transcripts are present at a higher level in guard cell protoplast preparations compared with extracts of whole leaves. Control levels of an actin PCR product indicate equal amounts of cDNA as starting material prior to PCR. B, Immunoblot analysis using anti-APY1 antibodies shows that immunodetectable protein levels of APY1/2 are higher in guard cell protoplast preparations compared with extracts of whole leaves. Control levels of α-tubulin (α-Tub) show equal loading of protein. Leaves taken from 3-week-old plants grown under identical conditions were used for both the protoplast preparations and the whole leaf extracts.
Figure 2.
Figure 2.
Open stomata have more active APY1/2 promoters, and light-treated guard cell protoplasts have higher APY1/2 protein levels. A, APY1:GUS and APY2:GUS plants were grown in low-humidity (33% RH) and high-humidity (85% RH) conditions. Leaves were harvested after 7 h of light (Day) and after 4 h in the dark (Night) and stained for GUS activity. Bright-field images of the abaxial epidermis of whole mount leaves from the APY2:GUS line 3-2-11 are shown representing the staining pattern of all four GUS lines analyzed. Dashed lines mark the outlines of some weakly stained guard cells in the top right panel. Bars = 100 μm. B, Western-blot analysis of APY1/APY2 protein levels in dark-adapted guard cell protoplasts after treatment with light at various time points. Treatment with light for 15 min results in an increase in immunodetectable APY1/APY2 protein levels. This result is representative of three biological repeats. α-Tub, α-Tubulin.
Figure 3.
Figure 3.
Chemical and immunological inhibition of apyrase activity induces stomatal closure. A, Application of anti-apyrase immune sera induced stomatal closure in whole leaves, but application of control preimmune sera had no effect on the aperture (5.2 μm average width for control). B, Application of apyrase inhibitor NGXT 191 induced stomatal closure in epidermal peels, and 100 μm PPADS blocked this closure, but 100 μm PPADS had no effect alone (5.3 μm average width for control). Apertures were measured as width/length after 1 h of treatment for peels and after 2 h of treatment for leaves. Error bars represent se. Different letters above the bars indicate mean values that are significantly different from one another as determined by Student’s t test (P < 0.05; n ≥ 50). These data are representative of three or more biological repeats.
Figure 4.
Figure 4.
Dose-response curves for the effects of various concentrations of ATPγS on stomatal aperture in epidermal peel experiments. A, Treatment with 10 μm ABA induced stomatal closure in the light, as did 200 and 250 μm ATPγS. Treatment with 150 μm ATPγS or 250 μm AMPS had no statistically significant effect on stomatal aperture (6.3 μm average width for control). B, Treatment with 1 h of light induced stomatal opening, and application of 5 and 15 μm ATPγS induced stomatal opening in darkness. Treatment with 15 μm AMPS had no effect on stomatal aperture (2.1 μm average width for control). Apertures were measured as width/length after 1 h of treatment. Error bars represent se. Different letters above the bars indicate mean values that are significantly different from one another as determined by Student’s t test (P < 0.05; n ≥ 50). These data are representative of three or more biological repeats.
Figure 5.
Figure 5.
The animal purinergic receptor antagonist PPADS blocks ATPγS-induced changes in stomatal aperture and partially blocks the effects of ABA and light on stomatal aperture. A, Treatment with 200 μm ATPγS induced stomatal closure in leaves and cotreatment with 100 μm PPADS blocked this closure, but 100 μm PPADS alone had no effect on stomatal aperture. Treatment with 10 μm ABA induced stomatal closure and cotreatment with 100 μm PPADS partially blocked this ABA-induced stomatal closing (4.9 μm average width for control). B, Treatment with 15 μm ATPγS induced stomatal opening in epidermal peels and cotreatment with 100 μm PPADS blocked this opening, but 100 μm PPADS alone had no effect on stomatal aperture. Treatment with light induced stomatal opening, although cotreatment with 100 μm PPADS partially blocked this light-induced stomatal opening (1.7 μm average width for control). Apertures were measured as width/length after 1 h of treatment for peels and after 2 h of treatment for leaves. Error bars represent se. Different letters above the bars indicate mean values that are significantly different from one another as determined by Student’s t test (P < 0.05; n ≥ 50). These data are representative of three or more biological repeats.
Figure 6.
Figure 6.
RNAi suppression of APY1 in an apy2 single knockout results in increased stomatal apertures compared with the Ws wild type (WSWT). A, Treatments with light and 10 μm ABA induce more open stomata in leaves of RNAi plants treated with estradiol compared with leaves of Ws wild-type plants treated with estradiol (1.5 μm average width for control). B, Treatments with light and 10 μm ABA have no effect on stomatal apertures in non-estradiol-treated leaves of RNAi plants compared with leaves of non-estradiol-treated Ws wild-type plants (1.7 μm average width for control). Apertures were measured as width/length after 2 h of treatment. Error bars represent se. Different letters above the bars indicate mean values that are significantly different from one another as determined by Student’s t test (P < 0.05; n ≥ 50). These data are representative of three or more biological repeats.
Figure 7.
Figure 7.
High concentrations of ATPγS induce stomatal closure via increased levels of NO and H2O2 in guard cells. A, Treatment of wild-type leaf tissue with 10 μm ABA or 200 μm ATPγS induces a differential accumulation of H2DCFDA fluorescence at 30 min in guard cells compared with control tissue. Different letters above the bars indicate mean values that are significantly different from one another (P < 0.05; n ≥ 25). These data are representative of three biological repeats. B, Treatment of wild-type leaf tissue with 10 μm ABA or 200 μm ATPγS induces a differential accumulation of DAF-2DA fluorescence at 45 min in guard cells compared with control tissue. C, Treatment with 200 μm ATPγS and 10 μm ABA induced stomatal closure in wild-type leaves but not in atrbohD/F leaves (4.5 μm average width for control). D, Treatment with 200 μm ATPγS and 10 μm ABA induced stomatal closure in wild-type leaves but not in nia1nia2 leaves (4.2 μm average width for control). Different letters above the bars indicate mean values that are significantly different from one another as determined by Student’s t test (P < 0.05; n ≥ 25 for fluorescence experiments and n ≥ 50 for stomatal aperture experiments). These data are representative of two biological repeats. Error bars represent se.
Figure 8.
Figure 8.
ABA treatment of light-adapted leaves induces the release of ATP in guard cells, as assayed by ecto-luciferase luminescence. A, Background levels of ecto-luciferase luminescence are observed in an epidermal peel from an untreated x-luc9 leaf (light control). B, An epidermal peel from an x-luc9 leaf treated with 10 μm ABA in light for 5 min shows ecto-luciferase luminescence in guard cells. C, An epidermal peel from an x-luc9 leaf treated with 1 mm ATP in light for 5 min shows ecto-luciferase luminescence in guard cells. Bars = 50 μm for A and B and 100 μm for C. Luminescence levels are represented in pseudocolor (blue, green, yellow, orange, and red, where red represents the highest and blue represents the lowest level of relative intensity). D, Quantification of luciferase activity from a representative data set of a closing experiment. Treatments with 10 μm ABA and 1 mm ATP were done in the light. Luminescence returned to untreated control levels 15 min after treatment with 10 μm ABA. Different letters above the bars indicate mean values that are significantly different from one another as determined by Student’s t test (P < 0.05; n ≥ 15 guard cell pairs). These data are representative of three biological repeats. Error bars represent se.
Figure 9.
Figure 9.
Light treatment of dark-adapted leaves induces the release of ATP in guard cells, as assayed by ecto-luciferase luminescence. A, Background levels of ecto-luciferase luminescence are observed in an epidermal peel from an untreated x-luc9 leaf (dark control). B, An epidermal peel from an x-luc9 leaf treated with 10 min of light shows ecto-luciferase luminescence in guard cells. C, An epidermal peel from an x-luc9 leaf treated with 1 mm ATP in the dark shows ecto-luciferase luminescence in guard cells. Bars = 50 μm for A and B and 100 μm for C. Luminescence levels are represented in pseudocolor (blue, green, yellow, orange, and red, where red represents the highest and blue represents the lowest level of relative intensity). D, Quantification of luciferase activity from a representative data set of an opening experiment. Treatment with 1 mm ATP was done in the dark. Luminescence returned to untreated control levels 25 min after treatment with light. Different letters above the bars indicate mean values that are significantly different from one another as determined by Student’s t test (P < 0.05; n ≥ 15 guard cell pairs). These data are representative of three biological repeats. Error bars represent se.
Figure 10.
Figure 10.
Model for the regulation of stomatal movements by extracellular nucleotides. Treatment with the nucleotides ATPγS and ADPβS at high concentrations (greater than 150–250 μm) induces stomatal closure and the release of NO and H2O2, whereas the addition of low concentrations of these nucleotides (15–35 μm) leads to the opening of stomata. These responses to either high (indicated by larger type) or low concentrations of nucleotides can be blocked by the mammalian purinoceptor inhibitors PPADS and RB2, which can also block the ability of ABA to induce stomatal closing and the ability of light to induce opening. The light treatment that induces stomatal opening also induces a higher expression of the transcripts and proteins of APY1 and APY2, and the text discusses the likelihood that these are ectoapyrases that would help regulate the concentrations of extracellular nucleotides during stomatal opening and closing.

Similar articles

Cited by

References

    1. Barbour MM, Buckley TN. (2007) The stomatal response to evaporative demand persists at night in Ricinus communis plants with high nocturnal conductance. Plant Cell Environ 30: 711–721 - PubMed
    1. Blum AE, Walsh BC, Dubyak GR. (2010) Extracellular osmolarity modulates G protein-coupled receptor-dependent ATP release from 1321N1 astrocytoma cells. Am J Physiol Cell Physiol 298: C386–C396 - PMC - PubMed
    1. Bright J, Desikan R, Hancock JT, Weir IS, Neill SJ. (2006) ABA-induced NO generation and stomatal closure in Arabidopsis are dependent on H2O2 synthesis. Plant J 45: 113–122 - PubMed
    1. Burnstock G. (2008) Purinergic signalling and disorders of the central nervous system. Nat Rev Drug Discov 7: 575–590 - PubMed
    1. Clark G, Roux SJ. (2009) Extracellular nucleotides: ancient signaling molecules. Plant Sci 177: 239–244

Publication types

MeSH terms