. 2011 Jul 8;333(6039):222-5.
doi: 10.1126/science.1203285. Epub 2011 Jun 2.

Coupled, circumferential motions of the cell wall synthesis machinery and MreB filaments in B. subtilis

Affiliations

Coupled, circumferential motions of the cell wall synthesis machinery and MreB filaments in B. subtilis

Ethan C Garner et al. Science. .

Abstract

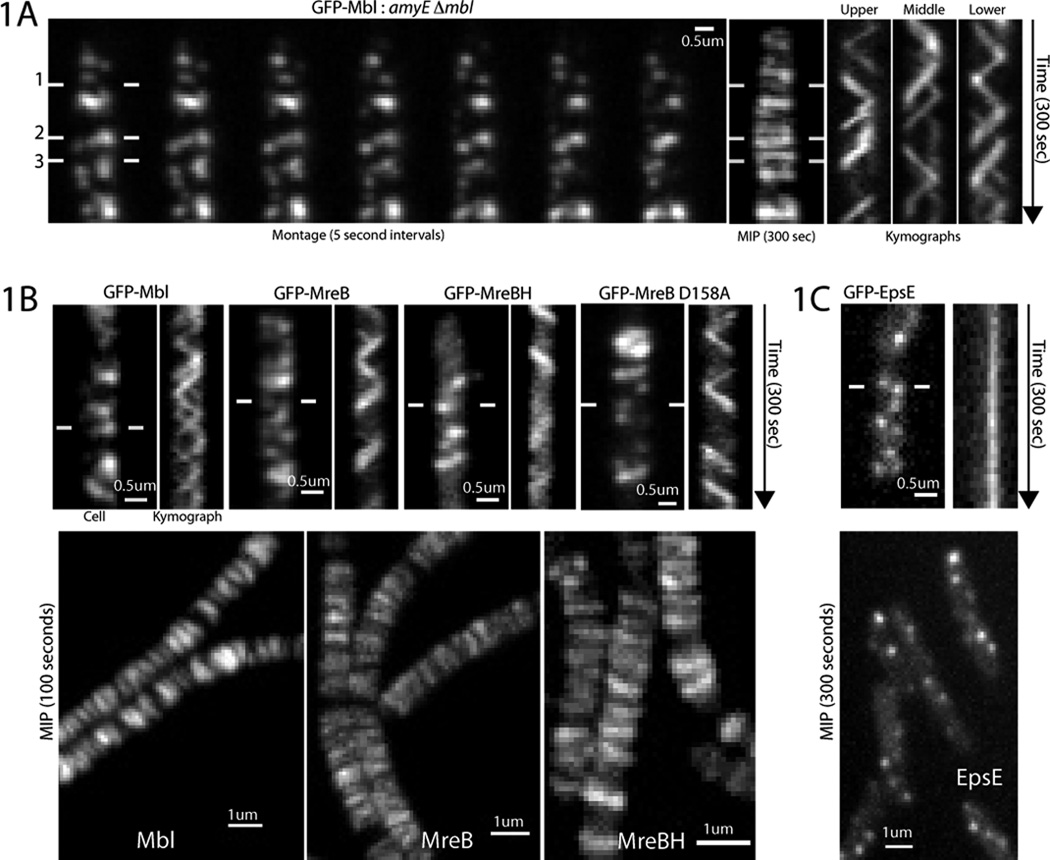
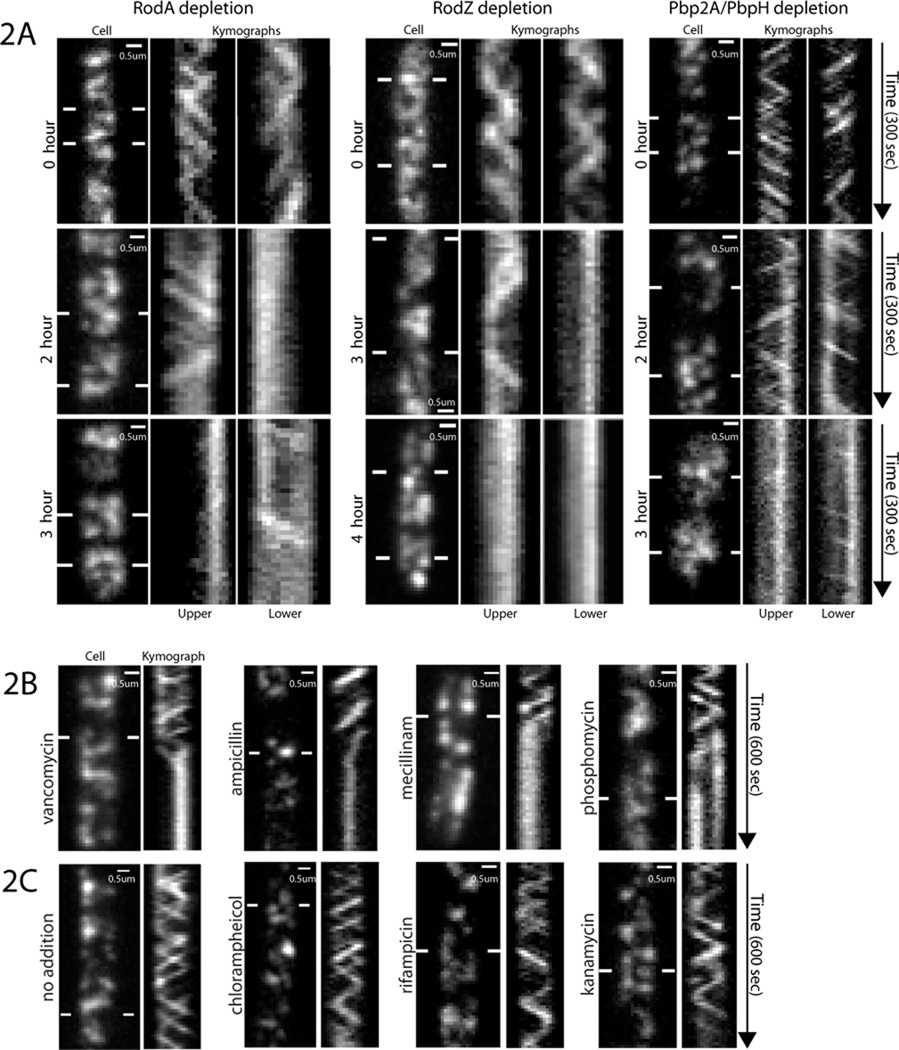
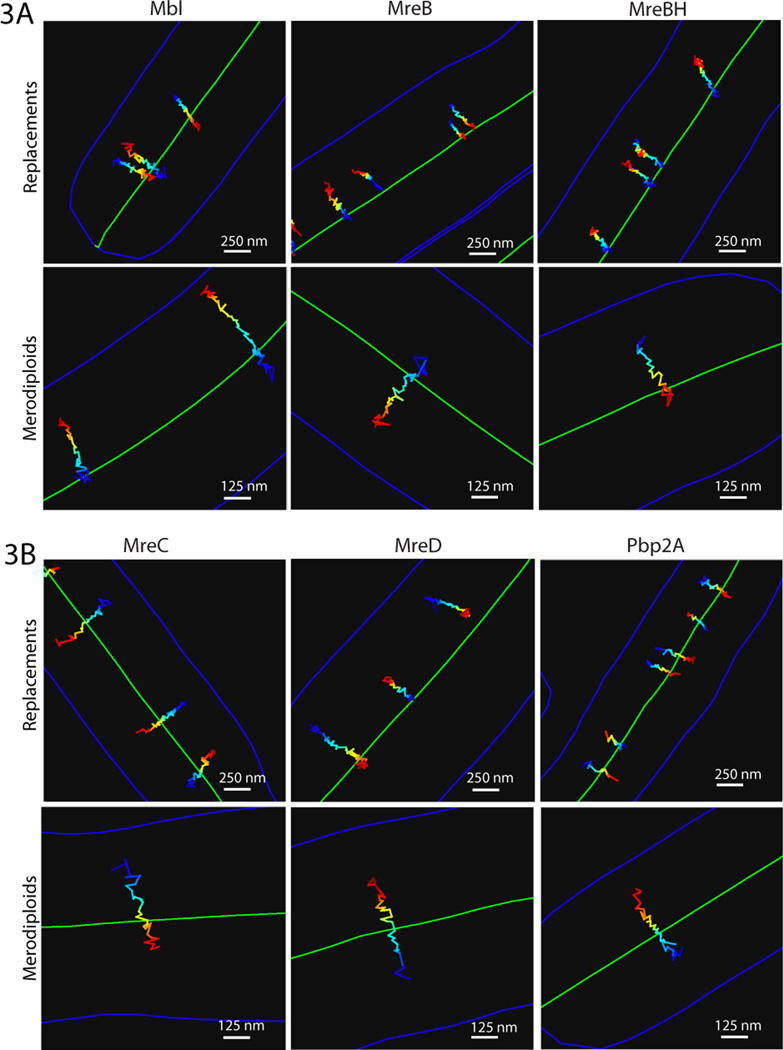
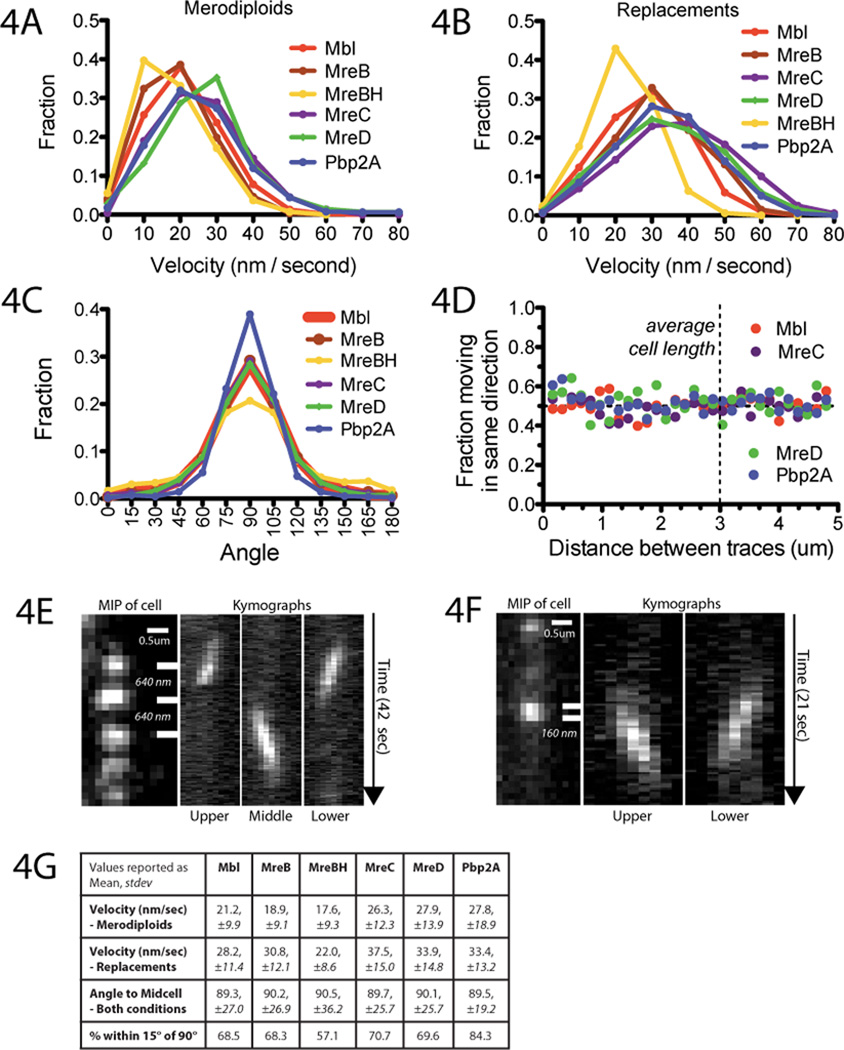
Rod-shaped bacteria elongate by the action of cell wall synthesis complexes linked to underlying dynamic MreB filaments. To understand how the movements of these filaments relate to cell wall synthesis, we characterized the dynamics of MreB and the cell wall elongation machinery using high-precision particle tracking in Bacillus subtilis. We found that MreB and the elongation machinery moved circumferentially around the cell, perpendicular to its length, with nearby synthesis complexes and MreB filaments moving independently in both directions. Inhibition of cell wall synthesis by various methods blocked the movement of MreB. Thus, bacteria elongate by the uncoordinated, circumferential movements of synthetic complexes that insert radial hoops of new peptidoglycan during their transit, possibly driving the motion of the underlying MreB filaments.


Figures

Fig. 1
Fig. 1. MreB paralogs display circumferential motion independent of the cell body
(A) Left: Montage of GFP-Mbl motion (BDR2061) from movie S1B. Middle: Maximal Intensity Projection (MIP) of movie S1B. Right: Kymographs drawn between lines in montage. Under our growth conditions Bacillus grows in long septate chains. (B) Top: Kymographs of GFP-Mbl, GFP-MreB, and GFP-MreBH in merodiploid strains. Far right: Kymograph showing axial motion of GFP-MreB(D158A), a mutation believed to inhibit ATP hydrolysis. Bottom: MIP of movies of GFP-Mbl, GFP-MreB, and GFP-MreBH. (C) Top: Kymograph of EpsE-GFP. Bottom: MIP of an EpsE-GFP movie.
Fig. 2
Fig. 2. Filament motion requires cell wall synthesis
(Kymographs are drawn between lines). (A) Kymographs of GFP-Mbl during depletions of IPTG-inducible genes: 1) RodA- a membrane-spanning component of the PGEM, 2) RodZ- a protein that links MreB to the PGEM and 3) Pbp2A- an elongation-specific transpeptidase, which was depleted in a strain lacking the redundant transpeptidase PbpH. Strains were grown in 2mM IPTG, shifted to media without IPTG, then imaged at the indicated times. (B) Kymographs showing antibiotics targeting cell wall synthesis freeze GFP-Mbl motion. BDR2061 was imaged following addition of 2µL of antibiotics to a 600µL agar pad. Initial concentrations: 10mg/ml ampicillin (blocks transpeptidation), 5mg/ml mecillinam (blocks transpeptidation), 80µg/ml vancomycin (blocks transglycosylation and transpeptidation), 50mg/ml phosphomycin (blocks PG precursor synthesis, 6uL added). (C) Kymographs showing off-target antibiotics do not affect GFP-Mbl motion. BDR2061 was incubated with indicated antibiotics for 2 minutes and immediately imaged. Final concentrations: 500µg/ml rifampicin (inhibits transcription), 500µg/ml kanamycin (inhibits translation), 340µg/ml chloramphenicol (inhibits translation).
Fig. 3
Fig. 3. Particle tracking of MreB paralogs and the PGEM shows linear movements across the cell
Representative traces of (A) MreB paralogs and (B) PGEM components from each expression condition. Trace color encodes time (blue to red) in 300msec steps. Cell outline is blue, midline green. Low-level expression of MreB, Mbl, MreC, and MreD in replacements resulted in wider cells, which we stabilized with magnesium (Figs. S4-5). For the MreB paralogs both expression methods yielded large numbers of foci that moved in linear paths across the cell width (movies S9B-C). Expression of PGEM proteins via both methods revealed that PGEM foci partition into two populations, one moving slowly and directionally and one moving rapidly and non-directionally, which we interpret to be diffusion within the membrane. When expressed at high levels as replacements, a dense mix of both populations was observed. As PGEM expression levels were reduced, the diffusing population effectively disappeared, leaving predominantly directionally moving foci that traversed the cell width (movies S10A-C). When expressed at low levels in merodiploids, both populations of PGEM foci were observed, with the directionally moving population comprising the minority (movie S11). Because we could only accurately track the slow directionally moving particles, all our data refers to this population.
Fig. 4
Fig. 4. Relative dynamics of the cell wall synthesis machinery and MreB
Histograms of velocity of GFP-fusions expressed as (A) merodiploids and (B) replacements. Velocity (V) was calculated by fitting MSD vs. t (Fig. S6) to MSD=(Vt)2 + 4Dt, yielding two distinct populations, high (> 5 ×10⁻⁴ nm/sec) and low (≤ 5×10⁻⁴ nm/sec) (Table S2, Fig. S7). Displayed are high velocity traces that moved in a consistent manner during their lifetime (>0.95 r2-fit to log(MSD) vs. log(t)). Plots of all data without r2-screening are in Fig. S7. (C) Distributions of the angles that traces cross the cell, determined by combining trajectories with segmented brightfield images (Fig. S10) (17). Shown are traces combined from both expression conditions over 20 frames in length with linear r2-fits > 0.5. Separate plots of each expression condition and different r2-screening criteria are in Fig. S11. (D) Linear traces (as in 4C) extracted from 100 seconds of imaging were evaluated pairwise to determine their relative directionality. The fraction of traces moving in the same direction is plotted as a function of distance in bins of 160nm. (E,F) Kymographs of proximal foci in merodiploid GFP-Mbl (E) and replacement GFPPpb2A (F) strains moving in opposing directions across one surface. Distance between kymograph bars is indicated in italics (See also: Fig. S15, movies S13A-D). (G) Summary table of tracking data.

Comment in

References

    1. Kruse T, et al. Mol Microbiol. 2005 Jan;55:78. - PubMed
    1. Kawai Y, et al. Mol Microbiol. 2009 Aug;73:719. - PubMed
    1. Bendezu FO, et al. EMBO J. 2009 Feb 4;28:193. - PMC - PubMed
    1. White CL, et al. Mol Microbiol. 2010 May;76:616. - PubMed
    1. Mayer JA, Amann KJ. Cell Motil Cytoskeleton. 2009 Feb;66:109. - PubMed

Publication types

MeSH terms