

How modeling can reconcile apparently discrepant experimental results: the case of pacemaking in dopaminergic neurons
- PMID: 21637742
- PMCID: PMC3102759
- DOI: 10.1371/journal.pcbi.1002050
How modeling can reconcile apparently discrepant experimental results: the case of pacemaking in dopaminergic neurons
Abstract
Midbrain dopaminergic neurons are endowed with endogenous slow pacemaking properties. In recent years, many different groups have studied the basis for this phenomenon, often with conflicting conclusions. In particular, the role of a slowly-inactivating L-type calcium channel in the depolarizing phase between spikes is controversial, and the analysis of slow oscillatory potential (SOP) recordings during the blockade of sodium channels has led to conflicting conclusions. Based on a minimal model of a dopaminergic neuron, our analysis suggests that the same experimental protocol may lead to drastically different observations in almost identical neurons. For example, complete L-type calcium channel blockade eliminates spontaneous firing or has almost no effect in two neurons differing by less than 1% in their maximal sodium conductance. The same prediction can be reproduced in a state of the art detailed model of a dopaminergic neuron. Some of these predictions are confirmed experimentally using single-cell recordings in brain slices. Our minimal model exhibits SOPs when sodium channels are blocked, these SOPs being uncorrelated with the spiking activity, as has been shown experimentally. We also show that block of a specific conductance (in this case, the SK conductance) can have a different effect on these two oscillatory behaviors (pacemaking and SOPs), despite the fact that they have the same initiating mechanism. These results highlight the fact that computational approaches, besides their well known confirmatory and predictive interests in neurophysiology, may also be useful to resolve apparent discrepancies between experimental results.
Conflict of interest statement
The authors have declared that no competing interests exist.
Figures
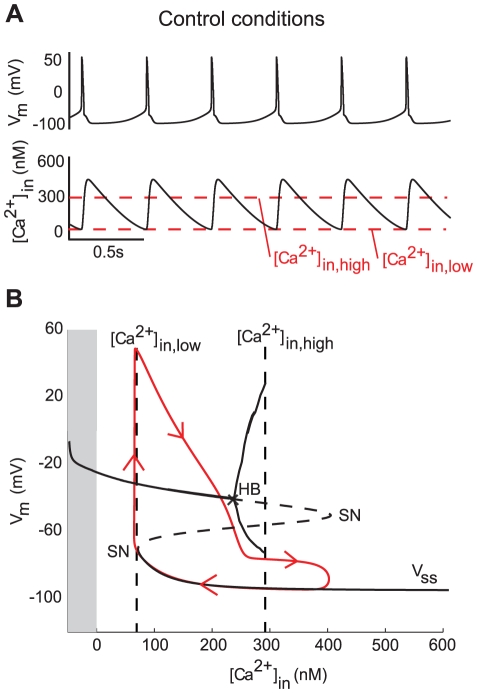
 as the bifurcation parameter. The gray part corresponds to negative values of
  , which is non physiological.
  denotes the steady-state curve for each value of the bifurcation parameters. The dotted part of
  shows its unstable part. HB denotes a Hopf bifurcation and SN a saddle-node bifurcation. The trajectory of the membrane potential is plotted in red.
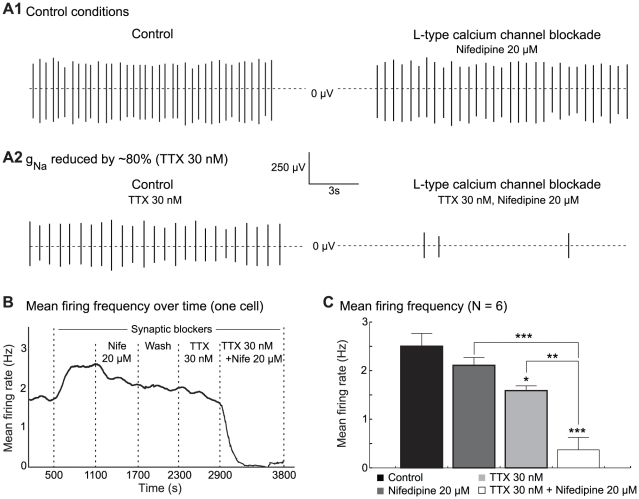
 M nifedipine (right). (A2) Same as (A1) after a 80
 reduction of the sodium conductance by the superfusion of 30 nM TTX. (B) Evolution of the mean firing rate (samples of 2 minutes) of a DA cell over time. (C) Mean firing frequency (N = 6) for each condition (mean
  sem). A simultaneous application of TTX and nifedipine affects the firing of the cells more strongly, as compared to the application of either of the two compounds alone. All experiments were performed in the presence of blockers of synaptic transmission. Note that the superfusion of the blockers produces an excitation of the neurons, which can be attributed to the block of inhibitory D2 autoreceptors. *P
 0.05, **P
 0.01, ***P
 0.001.
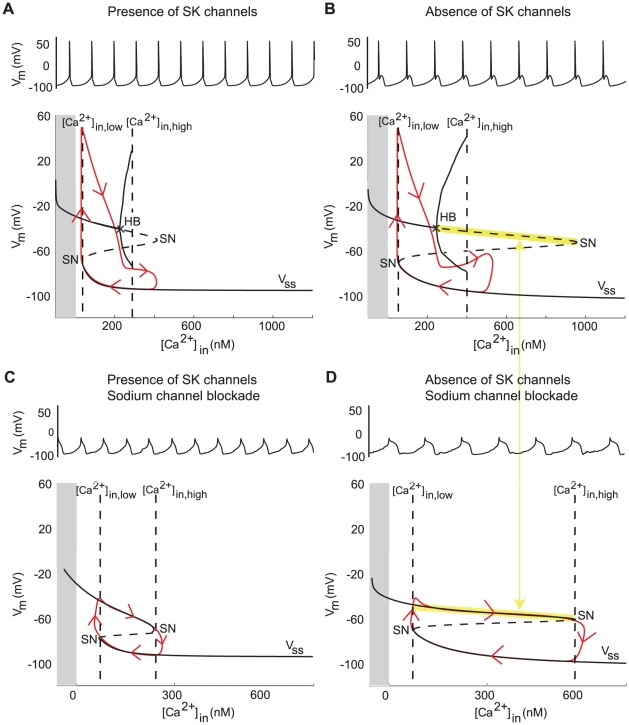
 as the bifurcation parameter) in the presence and in the absence of SK channels. The grey part corresponds to negative values of
  , which are non physiological.
  denotes the steady-state curve for each value of the bifurcation parameters. The dotted part of
  shows its unstable part. HB denotes a Hopf bifurcation and SN denotes a saddle-node bifurcation. Trajectories of the membrane potential are plotted in red. (C and D) Same as (A and B) but when sodium channels are blocked. The frequency of SOPs is almost halved, whereas the frequency of spikes is barely affected. This simulations were performed in the absence of noise, which would induce irregularities in the absence of SK channels.
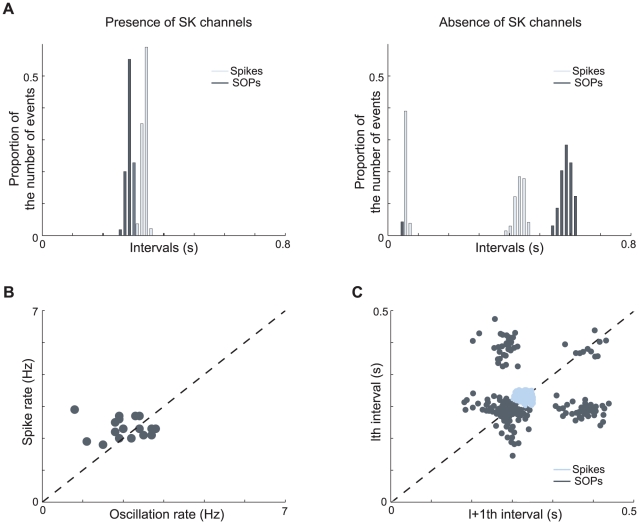
 and
and  . (C) Plot of successive spike intervals (light blue) or successive SOP intervals (dark blue) of a set of modeled cells. Although they are driven by the same mechanisms, spikes and SOPs are not correlated. Moreover, SOPs are more sensitive to the noise.