. 2011;6(5):e19544.
doi: 10.1371/journal.pone.0019544. Epub 2011 May 27.

An in silico modeling approach to understanding the dynamics of sarcoidosis

Affiliations

An in silico modeling approach to understanding the dynamics of sarcoidosis

Baltazar D Aguda et al. PLoS One. 2011.

Abstract

Background: Sarcoidosis is a polygenic disease with diverse phenotypic presentations characterized by an abnormal antigen-mediated Th1 type immune response. At present, progress towards understanding sarcoidosis disease mechanisms and the development of novel treatments is limited by constraints attendant to conducting human research in a rare disease in the absence of relevant animal models. We sought to develop a computational model to enhance our understanding of the pathological mechanisms of and predict potential treatments of sarcoidosis.

Methodology/results: Based upon the literature, we developed a computational model of known interactions between essential immune cells (antigen-presenting macrophages, effector and regulatory T cells) and cytokine mediators (IL-2, TNFα, IFNγ) of granulomatous inflammation during sarcoidosis. The dynamics of these interactions are described by a set of ordinary differential equations. The model predicts bistable switching behavior which is consistent with normal (self-limited) and "sarcoidosis-like" (sustained) activation of the inflammatory components of the system following a single antigen challenge. By perturbing the influence of model components using inhibitors of the cytokine mediators, distinct clinically relevant disease phenotypes were represented. Finally, the model was shown to be useful for pre-clinical testing of therapies based upon molecular targets and dose-effect relationships.

Conclusions/significance: Our work illustrates a dynamic computer simulation of granulomatous inflammation scenarios that is useful for the investigation of disease mechanisms and for pre-clinical therapeutic testing. In lieu of relevant in vitro or animal surrogates, our model may provide for the screening of potential therapies for specific sarcoidosis disease phenotypes in advance of expensive clinical trials.


Conflict of interest statement

Competing Interests: The authors have declared that no competing interests exist.

Figures

Figure 1
Figure 1. Bistable switching behavior of effector T cell (T) response.
A simple model of the response of effector T cells to antigens and cytokines predicts a threshold of antigen level that triggers a Th1 immune response (see Eqns 1 and 2). T in Eqn 1 is interpreted as Th1 activity. A square pulse of antigen with amplitude A1 = 3.5 (applied from t = 5 to t = 10) fails to increase T, while increasing the amplitude to A2 = 4 leads to a rapid increase in Th1 activity at the level T2. Parameters: θT = 1, βT = 0.02, εT = 1, c = 3, η 1 = η 2 = 1, initial T = 0.34.
Figure 2
Figure 2. Modeling assumptions for Th1 responses.
(A) The detailed immune network model involving Th1 activity (T), Tregs (R), and macrophages (M), with their interactions mediated by the cytokines IL-2, IFNγ, and TNFα. Arrows mean “upregulate” or activate while hammerheads mean “downregulate” or inhibit. A refers to the antigen presented by M to activate T. (Fig S2 in the Appendix shows a version of the network that corresponds to the differential equations of the model.) (B) A qualitative network (qNET) summarizing the pairwise interactions between the immune cells. Arrows ending with solid black circles represent either activation or inhibition. The edges a-f are explained in the text.
Figure 3
Figure 3. Antigen-dependency of Th1 activity.
The detailed model of Fig 2A predicts thresholds of antigen level or duration that trigger Th1 activity. Shown in this figure are the dynamics of the model variables at pre- and post-threshold duration of antigen exposure. The system is first allowed to reach the low steady states of all variables, and then exposed to a square pulse of antigen (with amplitude A = 100) from t = 20 to t = 69 (A and B) or from t = 20 to t = 70 (C and D) as indicated by the arrows on the abscissa. All parameters as in Table 2, except k2a = 2.1.
Figure 4
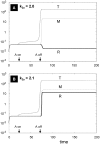
Figure 4. Sensitivity of Tregs (R) to the parameter k2a (response to IL-2).
The system is first allowed to reach the low steady states of all variables, and then exposed to a square pulse of antigen (with amplitude A = 100) from t = 20 to t = 70 as indicated by the arrows on the abscissa. All parameters as in Table 2, except k2a which when increased above a specific threshold (compare Panel A vs Panel B) promotes a dramatic increase in Tregs.
Figure 5
Figure 5. Single therapies using anti-IL2 (Iδ) or anti-IFNg (Iγ).
The system is first allowed to reach low steady states of all variables, and then exposed to a square pulse of antigen (with amplitude A = 100) from t = 20 to t = 70 to obtain a sarcoid state. As shown in (A) and (B), the model predicts that there is a threshold of anti-IL2 (between amplitudes Iδ = 29 and Iδ =  30) that will push the steady state of R to a low level, but not T and M. The anti-IL2 therapy is represented by asquare pulse of Id given between t = 100 and t = 120. And as shown in (C) and (D), the model also predicts that there is a threshold of anti-IFNγ (between amplitudes Iγ = 15 and Iγ = 16) that will push the steady state of M to a low level, but not T and R. The anti-IFNγ therapy is represented by a square pulse of Iγ given between t = 100 and t = 150. All parameters as in Table 2, except k2a = 2.1.
Figure 6
Figure 6. Combination therapies using anti-IL2 and anti-IFNγ.
The system is first allowed to reach low steady states of all variables, and then exposed to a square pulse of antigen (with amplitude A = 100) from t = 20 to t = 70 to obtain a sarcoid state. For (A)-(C), k2a = 2.0. Combinations of anti-IFNγ (Iγ) and anti-IL2 (Iδ) are applied as square pulses at the same time, between t = 100 and t = 120. The combination in (A) is not successful, while those of (B) and (C) are successful in pushing down the levels of T and M (although there is a slight increase in R compared to its level in (A), R is still very low). For (D)–(F), k2a = 2.1. An increase in anti-IL2 (Iδ) from 29 to 40 brings down R, but not T and M. Note that a small addition of Iγ as shown in (F) returns R to the high steady state level. All parameters as in Table 2, except k2a.
Figure 7
Figure 7. Single therapy using anti-TNFα (Iα).
The system is first allowed to reach low steady states of all variables, and then exposed to a square pulse of antigen with amplitude A = 100 from t = 20 to t = 70 (indicated by the first two black arrows from the left) to obtain a sarcoid state. (A) Without anti-TNFα (Iα = 0). (B) Anti-TNFα is introduced as a square pulse with amplitude Iα = 21.1 from t = 100 to t = 140 (indicated by the last pair of thick gray arrows); (C) Anti-TNFα is introduced as a square pulse with amplitude Ia = 21.2 from t = 100 to t = 140 (indicated by the last pair of thick gray arrows). All parameters as in Table 2, except k2a = 2.1 and k2b = 0.2.

References

    1. Iannuzzi MC, Rybicki BA, Teirstein AS. Sarcoidosis. N Engl J Med. 2007;357:2153–65. - PubMed
    1. Yates A, Callard R, Stark J. Combining cytokine signaling with T-bet and GATA-3 regulation in Th1 and Th2 differentiation: a model for cellular decision-making. J Theor Biol. 2004;231:181–96. - PubMed
    1. Mariani L, Lohning M, Radbruch A, Hofer T. Transcriptional control networks of cell differentiation: insights from helper T lymphocytes. Prog Biophys Mol Biol. 2004;86:45–76. - PubMed
    1. Mendoza L. A network model for the control of the differentiation process in Th cells. Biosystems. 2006;84:101–14. - PubMed
    1. Miyara M, Amoura Z, Parizot C, Badoual C, Dorgham K, et al. The immune paradox of sarcoidosis and regulatory T cells. J Exp Med. 2006;203:359–70. - PMC - PubMed

Publication types

MeSH terms