. 2011 May;7(5):e1002061.
doi: 10.1371/journal.pcbi.1002061. Epub 2011 May 26.

Simulation of the undiseased human cardiac ventricular action potential: model formulation and experimental validation

Affiliations

Simulation of the undiseased human cardiac ventricular action potential: model formulation and experimental validation

Thomas O'Hara et al. PLoS Comput Biol. 2011 May.

Abstract

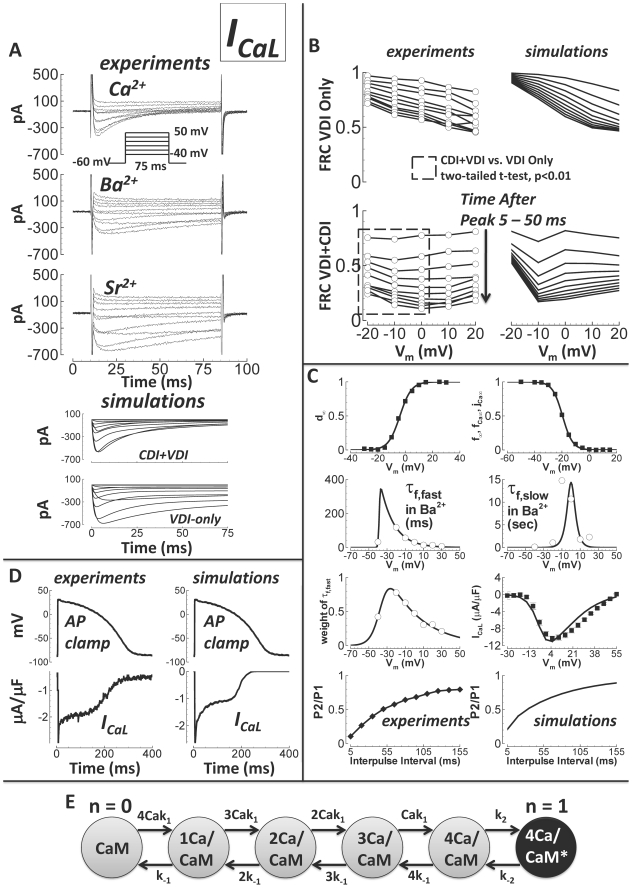
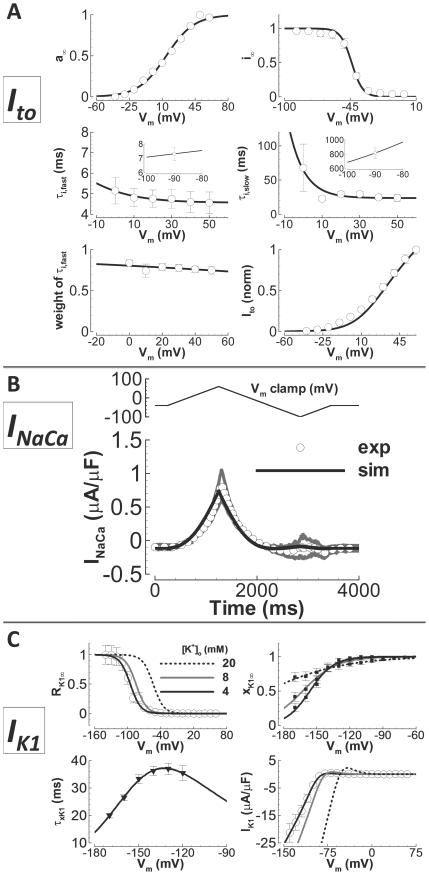
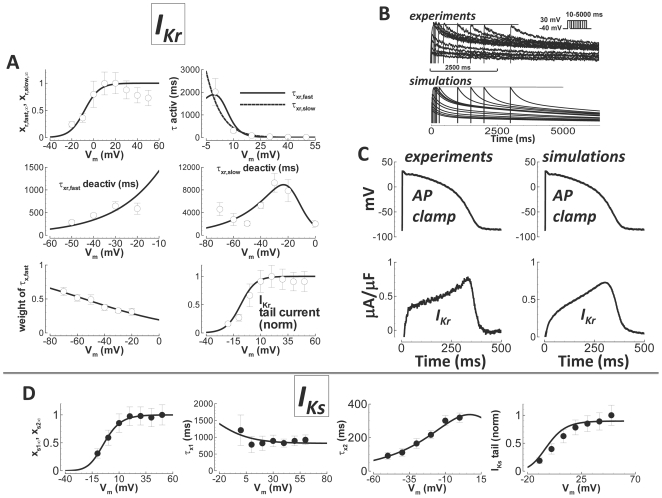
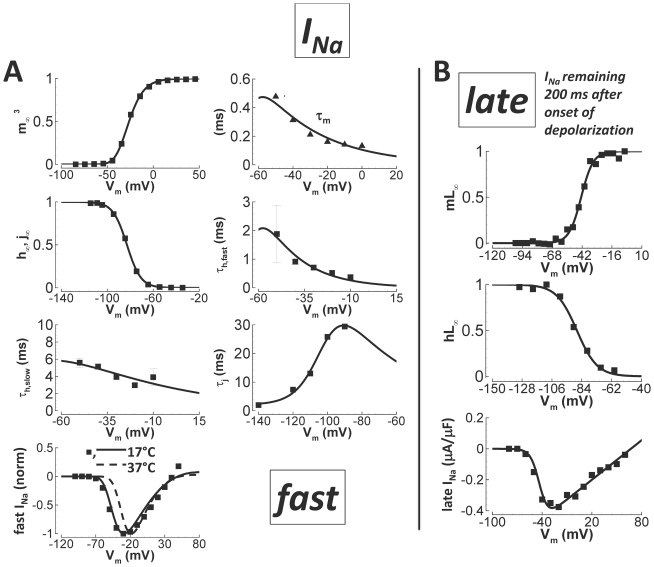
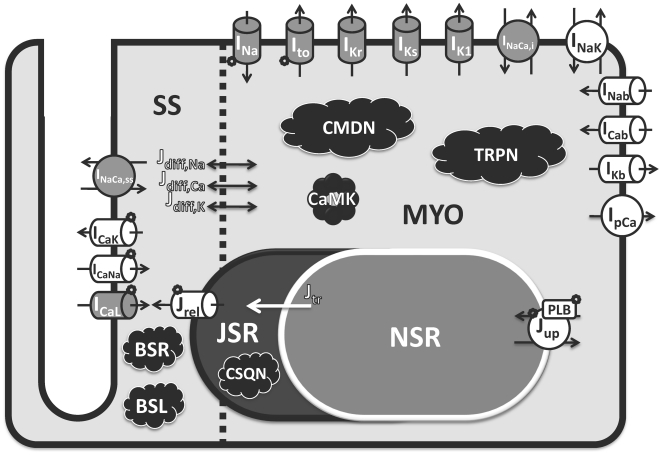
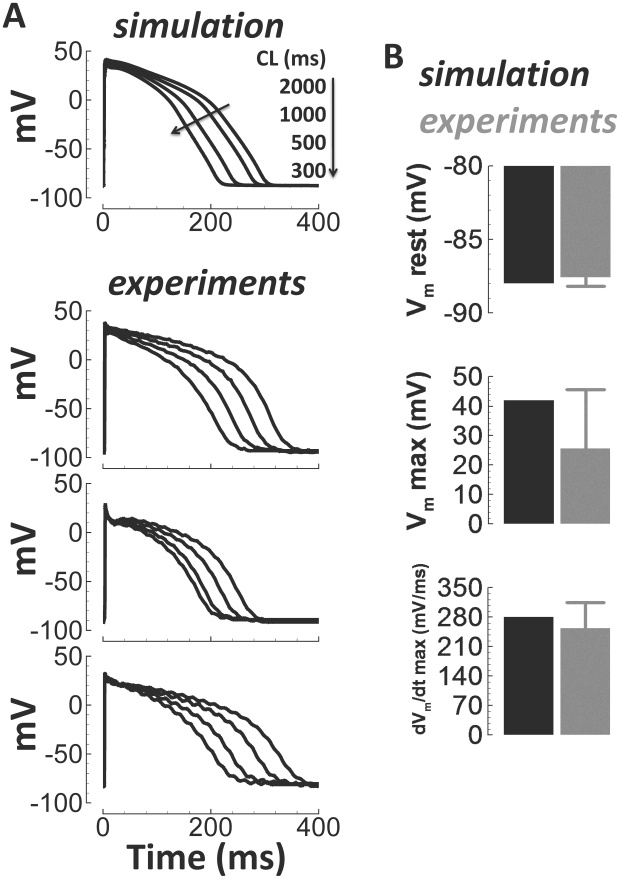
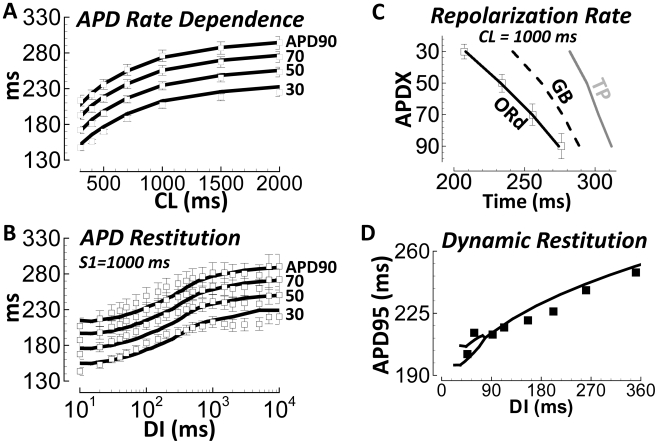
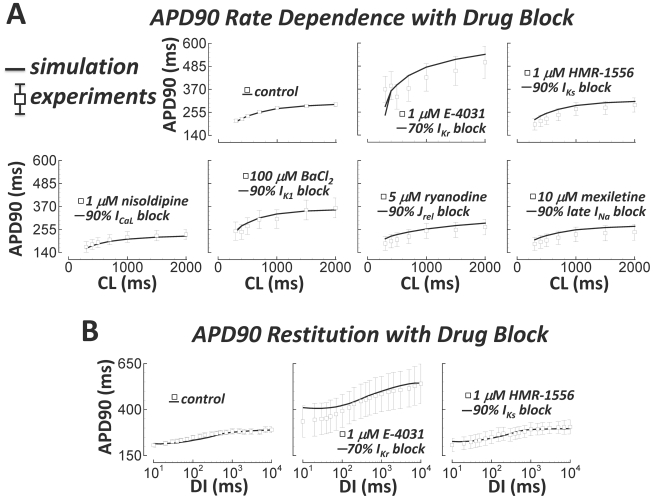
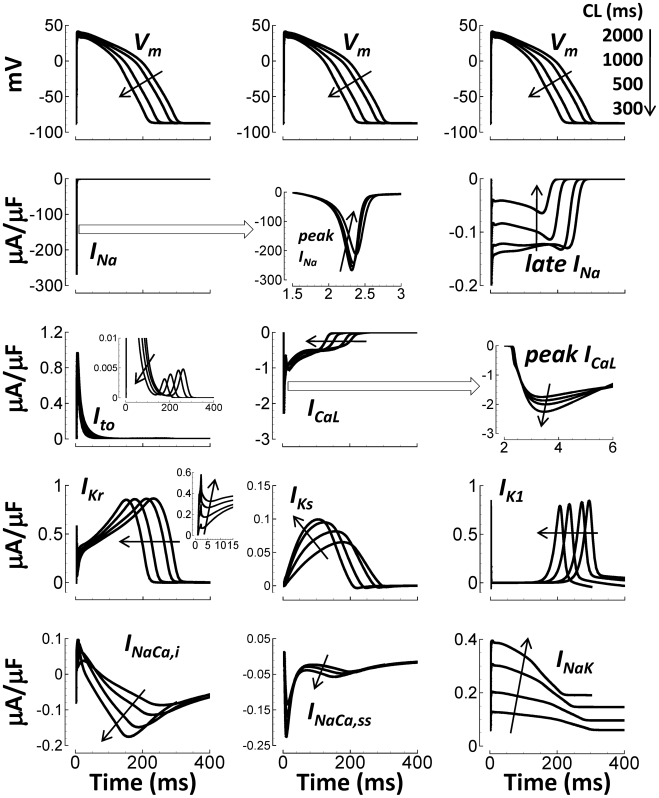
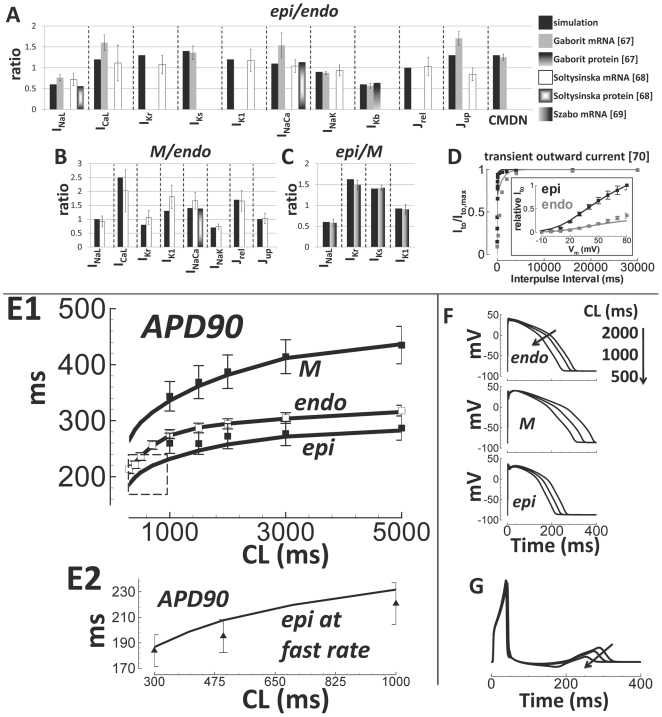
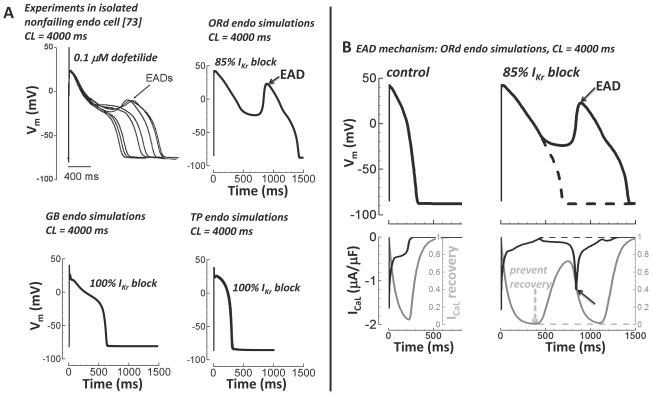
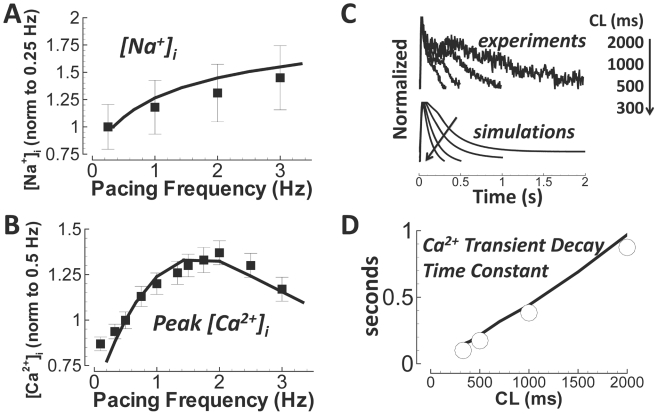
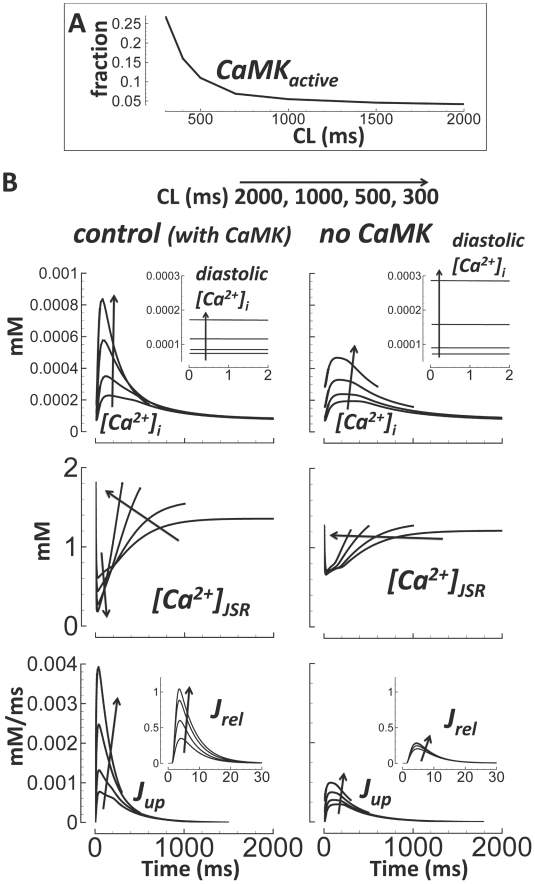
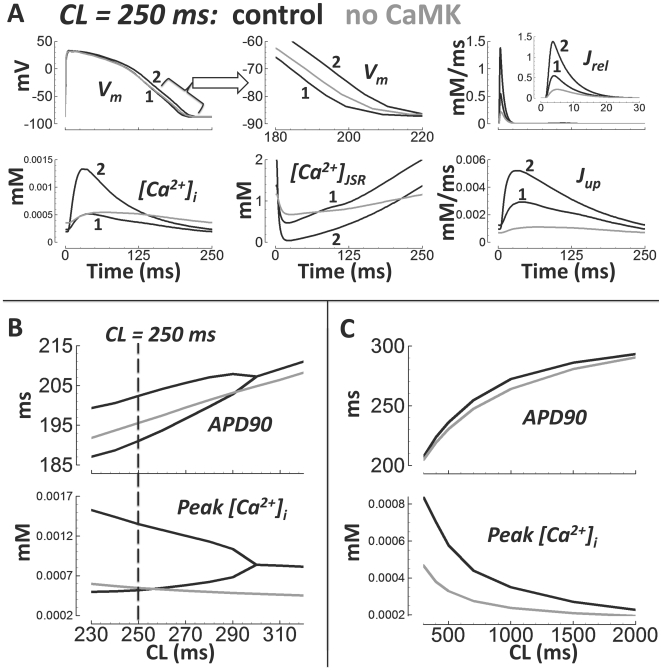
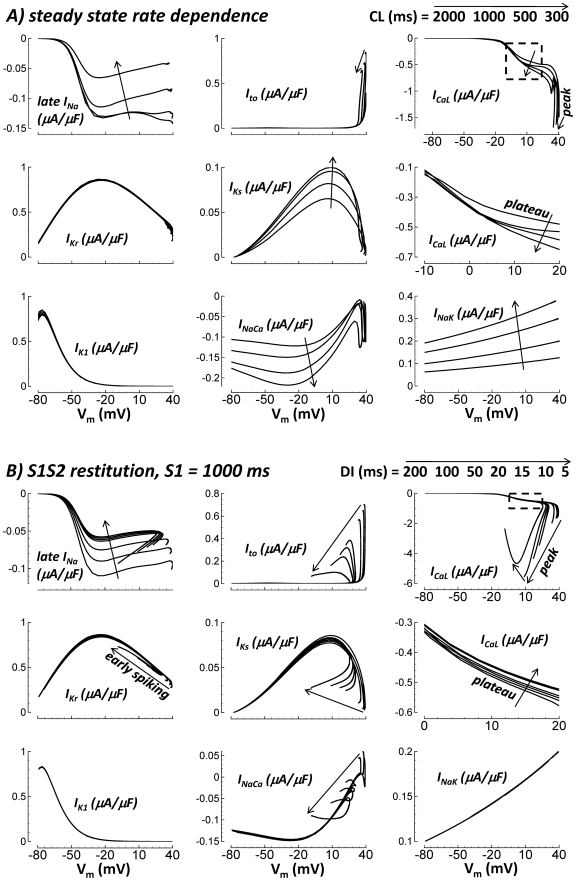
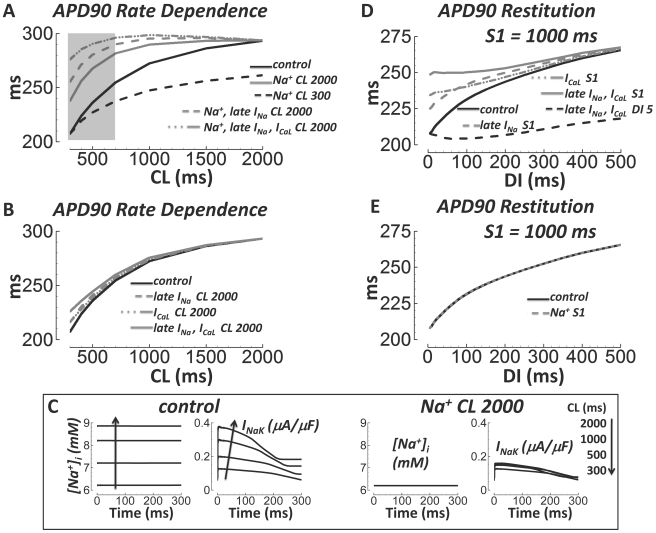
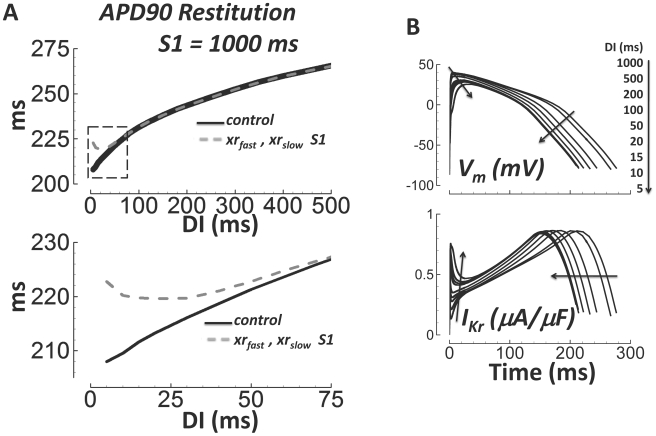
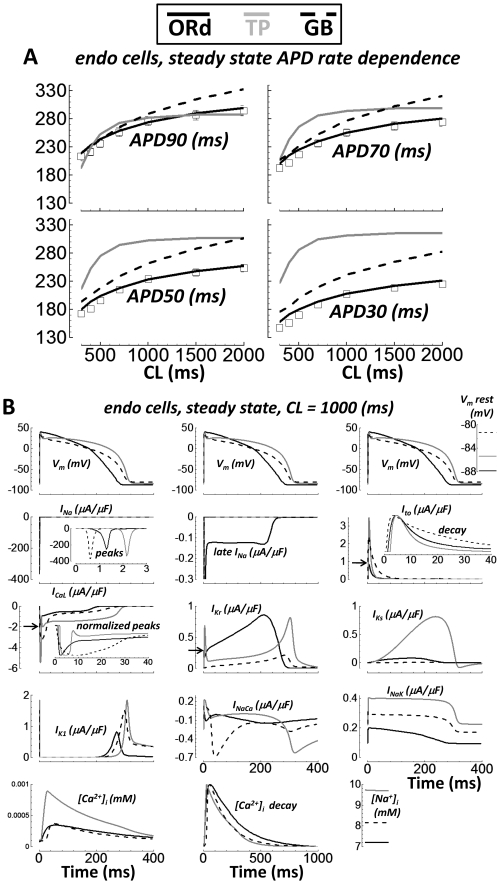
Cellular electrophysiology experiments, important for understanding cardiac arrhythmia mechanisms, are usually performed with channels expressed in non myocytes, or with non-human myocytes. Differences between cell types and species affect results. Thus, an accurate model for the undiseased human ventricular action potential (AP) which reproduces a broad range of physiological behaviors is needed. Such a model requires extensive experimental data, but essential elements have been unavailable. Here, we develop a human ventricular AP model using new undiseased human ventricular data: Ca(2+) versus voltage dependent inactivation of L-type Ca(2+) current (I(CaL)); kinetics for the transient outward, rapid delayed rectifier (I(Kr)), Na(+)/Ca(2+) exchange (I(NaCa)), and inward rectifier currents; AP recordings at all physiological cycle lengths; and rate dependence and restitution of AP duration (APD) with and without a variety of specific channel blockers. Simulated APs reproduced the experimental AP morphology, APD rate dependence, and restitution. Using undiseased human mRNA and protein data, models for different transmural cell types were developed. Experiments for rate dependence of Ca(2+) (including peak and decay) and intracellular sodium ([Na(+)](i)) in undiseased human myocytes were quantitatively reproduced by the model. Early afterdepolarizations were induced by I(Kr) block during slow pacing, and AP and Ca(2+) alternans appeared at rates >200 bpm, as observed in the nonfailing human ventricle. Ca(2+)/calmodulin-dependent protein kinase II (CaMK) modulated rate dependence of Ca(2+) cycling. I(NaCa) linked Ca(2+) alternation to AP alternans. CaMK suppression or SERCA upregulation eliminated alternans. Steady state APD rate dependence was caused primarily by changes in [Na(+)](i), via its modulation of the electrogenic Na(+)/K(+) ATPase current. At fast pacing rates, late Na(+) current and I(CaL) were also contributors. APD shortening during restitution was primarily dependent on reduced late Na(+) and I(CaL) currents due to inactivation at short diastolic intervals, with additional contribution from elevated I(Kr) due to incomplete deactivation.


Conflict of interest statement

The authors have declared that no competing interests exist.

Figures

Figure 1
Figure 1. Undiseased human ICaL experiments and model validation.
A) Experiments: ICaL traces for currents carried by Ca2+ (top), Ba2+ (middle), and Sr2+ (bottom). The voltage protocol is below the Ca2+ traces. Ca2+ current decay was visibly more rapid than decay for Ba2+ or Sr2+ currents. Simulations: ICaL in response to the same voltage protocol with CDI (CDI+VDI, top), and without CDI (VDI-only, bottom). B) Experimental data are on the left (white circles, N = 5, from 3 hearts). Simulation results are on the right (solid lines). FRC is fractional remaining current. Times after peak current shown are from 5 to 55 ms, in 5 ms steps (indicated by arrow). Top left) Experiments showing the voltage and time dependence of FRC with Ba2+ as charge carrier (VDI only). Top right) Simulations of FRC, with n−gate = 0 (representing VDI only; see text and panel E). Bottom left) Experiments showing FRC with Ca2+ as charge carrier (CDI and VDI are concurrent). FRC for CDI+VDI was significantly smaller at more hyperpolarized potentials (Vm = −20 to 0 mV, dashed box) than FRC for VDI-alone. Bottom right) Simulations of FRC with free running n gate, allowing both CDI and VDI to occur. C) Data are from Magyar et al. (black squares), Fulop et al. (black diamonds), and previously unpublished (white circles, N = 5, from 3 hearts). Simulation results are solid lines. From left to right, top to bottom: steady state activation, steady state inactivation, fast time constant for VDI, slow time constant for VDI, relative weight of the fast component for VDI, I–V curve, experiments showing recovery from inactivation, and corresponding simulations. D) Human AP clamp waveform, used to elicit 1 µM nisoldipine sensitive current (ICaL, experiments, left) and comparison to simulations using the same AP clamp (right). E) Schematic diagram for the n gate, representing the fraction of L-type channels undergoing CDI. Calmodulin (CaM) is constitutively attached to the L-type channel. Ca2+ ions bind to CaM (on-rate k1 and off-rate k-1). With Ca2+ ions bound, the Ca2+/CaM/channel complex may activate CDI mode (asterisk and black color indicate CDI activation, on-rate k2 and off-rate k-2).
Figure 2
Figure 2. Undiseased human Ito, INaCa, and IK1 experiments and model validation.
A) Ito. Experimental data are white circles (N = 8 from 5 hearts for inactivation time constants, N = 10 from 5 hearts for recovery time constants, N = 9 from 6 hearts for steady state inactivation, and N = 23 from 8 hearts for the I–V curve). Simulation results are solid lines. From left to right, top to bottom: steady state activation, steady state inactivation, fast time constant for inactivation, slow time constant for inactivation (insets show fast and slow recovery from inactivation), relative weight of the fast component for inactivation and the I–V curve (normalized). B) INaCa. Experimental data are digitally averaged time traces (N = 3 from 2 hearts, white circles, gray is standard error of the mean). Simulation results are the solid line. Top) Voltage clamp protocol. Bottom) INaCa in response to the clamp. C) IK1. Experimental data are previously unpublished (white circles, N = 21 from 12 hearts), from Bailly et al. (black squares) and Konarzewska et al.(black triangles). Simulation results are solid lines (black, gray and dashed black for [K+]o = 4, 8 and 20 mM). Top left) Voltage and [K+]o dependence of steady state rectification. Top right) Voltage and [K+]o dependence of steady state inactivation. Bottom left) Time constant for inactivation. Bottom right) I–V curve, and its [K+]o dependence.
Figure 3
Figure 3. Undiseased human IKr and IKs experiments and model validation.
A) IKr. Experimental data are white circles (N = 10 from 7 hearts for steady state activation, N = 7 from 3 hearts for activation and from 2 hearts for deactivation time constants and weights, and N = 10 from 7 hearts for tail currents). Simulation results are lines. From left to right, top to bottom: steady state activation, time constant for activation (fast (solid) and slow (dashed) time constants converge), fast time constant for deactivation, slow time constant for deactivation, relative weight of the fast component for deactivation, and the I–V curve for normalized tail currents. B) Activation/deactivation profiles in response to the voltage steps shown (−40 mV holding potential to +30 mV steps of various duration, followed by a return to −40 mV, top right inset). Experiments are above. Simulations are below. Activation is rapid, occurring within tens of milliseconds. Deactivation is slow, occurring after several seconds. C) Human AP clamp waveform (top), used to elicit 1 µM E-4031 sensitive current (IKr, bottom); experiments are on the left, and comparison to simulations using the same AP clamp is on the right. D) IKs. Data are from Virág et al. (black circles). Simulation results are solid lines. From left to right: steady state activation, time constant for activation (much slower than deactivation at depolarized potentials), time constant for deactivation (much faster than activation at hyperpolarized potentials), and the I–V curve, showing normalized tail currents.
Figure 4
Figure 4. Nonfailing human fast INa and late INa experiments and model validation.
A) Fast INa. Experiments are from Sakakibara et al. (black squares) and Nagatomo et al. (black triangles). Simulation results are solid lines. From left to right, top to bottom: steady state activation, time to peak (experiment) and activation time constant (simulation), steady state inactivation, fast time constant for development of inactivation, slow time constant for development of inactivation, time constant for recovery from inactivation, and the I–V curve (solid line simulation and data at 17°C, dashed line simulation at 37°C). In other panels, simulations and data were adjusted to 37°C. Time to peak was fit at 33°C. B) Late INa. Experiments are from Maltsev et al. (black squares). Simulation results are solid lines. Top) Steady state activation. Middle) Steady state inactivation. Bottom) I–V curve.
Figure 5
Figure 5. Schematic diagram of human ventricular myocyte model.
Formulations for all currents and fluxes were based either directly (gray) or indirectly (white) on undiseased or nonfailing human experimental data. Model includes four compartments: 1) bulk myoplasm (myo), 2) junctional sarcoplasmic reticulum (JSR), 3) network sarcoplasmic reticulum (NSR), and 4) subspace (SS), representing the space near the T-tubules. Currents into the myoplasm: Na+ current (INa; representing both fast and late components), transient outward K+ current (Ito), rapid delayed rectifier K+ current (IKr), slow delayed rectifier K+ current (IKs), inward rectifier K+ current (IK1), 80% of Na+/Ca2+ exchange current (INaCa,i), Na+/K+ pump current (INaK), background currents (INab, ICab, and IKb), and sarcolemmal Ca2+ pump current (IpCa). Currents into subspace: L-type Ca2+ current (ICaL, with Na+ and K+ components ICaNa, ICaK), and 20% of Na+/Ca2+ exchange current (INaCa,ss). Ionic fluxes: Ca2+ through ryanodine receptor (Jrel), NSR to JSR Ca2+ translocation (Jtr), Ca2+ uptake into NSR via SERCA2a/PLB (Jup; PLB - phospholamban), diffusion fluxes from subspace to myoplasm (Jdiff,Na, Jdiff,Ca, and Jdiff,K). Ca2+ Buffers: calmodulin (CMDN), troponin (TRPN), calsequestrin (CSQN), anionic SR binding sites for Ca2+ (BSR), anionic sarcolemmal binding sites for Ca2+ (BSL). Ca2+/calmodulin-dependent protein kinase II (CaMK) and its targets are labeled.
Figure 6
Figure 6. Undiseased human endocardial AP traces from experiments (small tissue preparations) and model simulations.
Simulated APs for a range of pacing frequencies (top) and corresponding examples of experimentally recorded APs at 37°C (below). Arrows indicate cycle length (CL) changes. B) Comparison of simulation (black) and experimentally measured (gray, small tissue preparations) basic AP parameters for a single paced beat from quiescence (37°C, N = 32 from 32 hearts). Shown, from top to bottom, are the resting membrane potential (Vm rest), maximum upstroke potential (Vm max), and maximum upstroke velocity (dVm/dt max).
Figure 7
Figure 7. Undiseased human endocardial AP response to pacing protocols from experiments (small tissue preparations) and model simulations.
A) Steady state APD rate dependence. B) S1S2 APD restitution (DI – diastolic interval). APD30–90 are labeled at right. Solid lines are simulation results; white squares are experiments at 37°C (N = 140 hearts in panel A, N = 50 hearts in panel B). C) Repolarization rate at CL = 1000 ms. Trajectory of APD30 to APD90 is accurate in the ORd model (white squares are experimental data); less so in other models. D) Dynamic restitution protocol (see Methods). Experiments are from Koller et al., measured in nonfailing human hearts with monophasic AP electrodes (black squares). Simulated results are the black line. At very short diastolic intervals (DI<90 ms), the model shows APD bifurcation (alternans).
Figure 8
Figure 8. Pacing protocols with block of various currents.
Experimental data (small tissue preparations) are white squares. A) Steady state APD90 rate dependence. From left to right, top to bottom: N = 140, 5, 5, 5, 5, 4, and 4 hearts. Shown are control, IKr, IKs, ICaL, IK1, RyR, and late INa block. B) APD90 restitution (S1 = 1000 ms). From left to right: N = 50, 3, and 4 hearts. Shown are control, IKr, and IKs block.
Figure 9
Figure 9. Rate dependence of currents at steady state.
Black arrows indicate CL decrease (rate increase). Top Row) Simulated APs, repeated in each column for timing purposes. Lower Rows (left to right, top to bottom): INa, peak INa detailed time course, late INa, Ito, ICaL, ICaL increasing peaks with increasing pacing rate, IKr, IKs, IK1, INaCa,i, INaCa,ss, and INaK. Insets show greater detail of late small Ito window current, and early IKr spiking at fast rates.
Figure 10
Figure 10. Transmural heterogeneity and validation of transmural cell type models.
A–C) Expression ratio in the model (black bars) compared to experimental data from undiseased human hearts (grayscale bars, labeled). D) Transmural heterogeneity of Ito; simulations are lines, experiments are squares. Results for endo are gray; those for epi are black. E1) Rate dependence of APD90 in endo, M, and epi cell types. Epi and M data were obtained by scaling endo data (white squares) by epi/endo and M/endo APD90 ratios from Drouin et al. (black squares). Simulations are black lines. E2) Same format as panel E1, showing epi APD90 at faster pacing rates. Data are from Glukhov et al., (epi/endo scaling, black triangles). F) Top to bottom: Rate-dependence of endo, M, and epi APs. G) Pseudo-ECG, using a simulated transmural wedge. CL changes are indicated by arrows.
Figure 11
Figure 11. Early afterdepolarizations (EADs).
A) Top left) Experiments in isolated nonfailing human endo myocytes from Guo et al. showed EADs with slow pacing (CL = 4000 ms) in the presence of IKr block (0.1 µM dofetilide, ∼85% IKr block, reproduce with permission). Top right) Following the experimental protocol of Guo et al. (CL = 4000 ms, 85% IKr block) the ORd model accurately showed a single large EAD. Bottom) GB (left) and TP (right) models failed to generate EADs (CL = 4000 ms, even with 100% IKr block). B) EAD mechanism. APs are on top. ICaL (black) and ICaL recovery gate (gray) are below. Slow pacing alone (CL = 4000 ms) did not cause an EAD (left). Slow pacing plus IKr block (85%) caused an EAD (solid lines, right). The EAD was depolarized by ICaL reactivation during the slowly repolarizing AP plateau (solid lines, solid arrows). When ICaL recovery was prevented, the EAD was eliminated (dashed lines and dashed arrow).
Figure 12
Figure 12. Rate dependence of intracellular ion concentrations.
Simulation results are solid lines. A) [Na+]i versus pacing frequency (normalized to 0.25 Hz). Experiments are from nonfailing myocytes (Pieske et al., black squares). B) Peak Ca2+ transient (normalized to 0.5 Hz). Experiments are from nonfailing myocytes (Schmidt et al., black squares). C) Ca2+ transients from experiments (Fura-2-AM) and simulations. Results are normalized to illustrate the time course of decay. The arrow indicates pacing CL changes. D) Frequency dependent acceleration of relaxation. Undiseased human experimental data are white circles. Simulations are the black line.
Figure 13
Figure 13. CaMK and Ca2+ cycling.
A) Rate dependence of CaMK active fraction. B) Ca2+ cycling under control conditions (left) and without CaMK (right). CL changes are indicated by arrows. Top) [Ca2+]i and diastolic values (inset). Middle) [Ca2+]JSR. Bottom) Jup and Jrel (inset, expanded time scale).
Figure 14
Figure 14. AP and Ca2+ alternans at fast pacing.
Black lines are control. Gray lines are without CaMK. The two consecutive beats are labeled 1 and 2. A) Pacing at CL = 250 ms. From left to right, top to bottom: AP, expanded time scale showing AP repolarization, Jrel (inset is expanded time scale), [Ca2+]i, [Ca2+]JSR, and Jup. B) Rate dependence of APD (top) and peak [Ca2+]i (bottom) at fast rates (alternans bifurcations disappear without CaMK). C) Same as panel B, but at slower rates (no bifurcations).
Figure 15
Figure 15. I–V curves during steady state rate dependent pacing at various CLs (panel A), and S1S2 restitution at various DIs (panel B).
Arrows indicate decreasing CL or DI. From left to right, top to bottom, results for late INa, Ito, ICaL, IKr, IKs, zoom of plateau ICaL (dashed box section), IK1, INaCa, and INaK are shown.
Figure 16
Figure 16. Major causes of steady state APD rate dependence and S1S2 APD restitution.
A) APD rate dependence in control (solid black), and with [Na+]i and [Na+]ss clamped to slow rate (solid gray) or fast rate (dashed black) values. When late INa (dashed gray) or both late INa and ICaL inactivation gates were reset to their slow rate values (dash-dot-dot gray) in addition to [Na+]i and [Na+]ss slow rate clamp, APD lost almost all rate dependence. Note that slow rate [Na+]i and [Na+]ss clamp alone left residual APD rate dependence, especially at fast rates (CL = 300 to 700 ms, shaded box). B) APD rate dependence (control, solid black) was largely unaffected by resetting inactivation gates for late INa (dashed gray), ICaL (dash-dot-dot gray), or late INa and ICaL (solid gray) to their slow rate values (no [Na+]i and [Na+]ss clamping to slow rate values). C) [Na+]i and INaK increase with pacing rate under control conditions (left). When [Na+]i and [Na+]ss are clamped to slow rate values, INaK is small and rate independent (right). D) APD restitution in control (solid black), and when inactivation gates were reset to S1 values upon S2 delivery (late INa reset – dashed gray, ICaL reset – dash-dot-dot gray, late INa and ICaL reset – solid gray). Shown in dashed black is resetting late INa and ICaL inactivation to the DI = 5 ms value. E) [Na+]i and [Na+]ss clamp to S1 values (dashed gray) did not affect APD restitution (control, solid black).
Figure 17
Figure 17. IKr deactivation is important for APD restitution at very short DIs.
A) APD restitution in control (solid black), and when the fast and slow deactivation gates (xrfast and xrslow) were reset to the DI = S1 = 1000 ms value at the start of the S2 beat (dashed gray). Bottom) Zoom in to more clearly show the consequence of deactivation resetting at short DIs (section outlined by dashed box above). B) Traces for the AP (top) and IKr (bottom) during the S2 beat at different DIs (indicated by arrows). Spiking in IKr occurred early during the AP at short DI. Spiking was caused by slow deactivation, increasing availability of IKr.
Figure 18
Figure 18. Comparison with other human ventricular AP models.
Single endo cell simulations from ORd, TP, and GB models are solid black, gray, and dashed black lines, respectively. Experimental results (small tissue preparations) are white squares. A) APD rate dependence. Results for APD90, 70, 50 and 30 are shown top left, top right, bottom left, and bottom right, respectively. B) The AP, major currents, [Na+]i, and [Ca2+]i at steady state for CL = 1000 ms. From left to right, top to bottom: AP (with Vm rest inset at far right), INa (inset shows peaks), late INa (not present in TP or GB models), Ito (inset shows decay rate), ICaL (arrow shows ORd peak magnitude; inset shows normalized peaks, which are wide in TP and GB), IKr (arrow shows ORd early spike peak magnitude), IKs, IK1, INaCa, INaK, [Ca2+]i, [Ca2+]i decay rate, and [Na+]i.

References

    1. Myerburg RJ. Scientific gaps in the prediction and prevention of sudden cardiac death. J Cardiovasc Electrophysiol. 2002;13:709–723. - PubMed
    1. Winslow RL, Cortassa S, O'Rourke B, Hashambhoy YL, Rice JJ, et al. Integrative modeling of the cardiac ventricular myocyte. 2010. Wiley Interdiscip Rev Syst Biol Med DOI: 101002/wsbm122 [Epub ahead of print] - PMC - PubMed
    1. Ackerman MJ, Mohler PJ. Defining a new paradigm for human arrhythmia syndromes: phenotypic manifestations of gene mutations in ion channel- and transporter-associated proteins. Circ Res. 2010;107:457–465. - PMC - PubMed
    1. Akar FG, Wu RC, Deschenes I, Armoundas AA, Piacentino V, 3rd, et al. Phenotypic differences in transient outward K+ current of human and canine ventricular myocytes: insights into molecular composition of ventricular Ito. Am J Physiol Heart Circ Physiol. 2004;286:H602–609. - PubMed
    1. Blechschmidt S, Haufe V, Benndorf K, Zimmer T. Voltage-gated Na+ channel transcript patterns in the mammalian heart are species-dependent. Prog Biophys Mol Biol. 2008;98:309–318. - PubMed

Publication types