. 2011 Aug;79(8):2380-8.
doi: 10.1002/prot.23046. Epub 2011 Jun 2.

Incorporation of evolutionary information into Rosetta comparative modeling

Affiliations

Incorporation of evolutionary information into Rosetta comparative modeling

James Thompson et al. Proteins. 2011 Aug.

Abstract

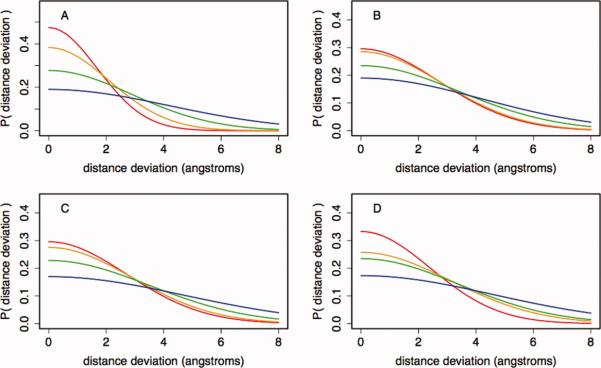
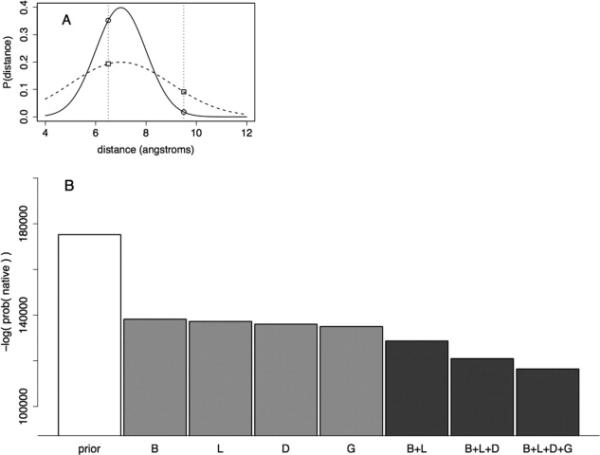
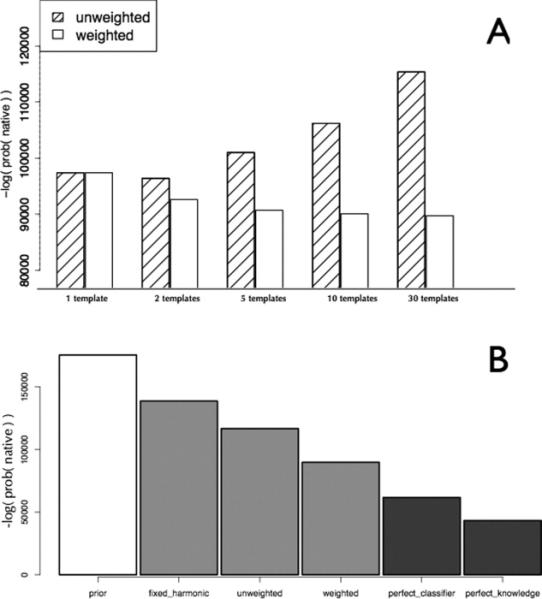
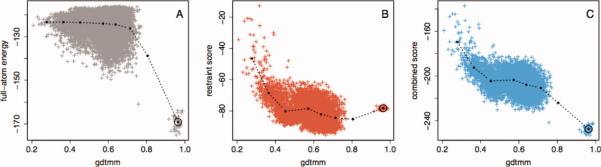
Prediction of protein structures from sequences is a fundamental problem in computational biology. Algorithms that attempt to predict a structure from sequence primarily use two sources of information. The first source is physical in nature: proteins fold into their lowest energy state. Given an energy function that describes the interactions governing folding, a method for constructing models of protein structures, and the amino acid sequence of a protein of interest, the structure prediction problem becomes a search for the lowest energy structure. Evolution provides an orthogonal source of information: proteins of similar sequences have similar structure, and therefore proteins of known structure can guide modeling. The relatively successful Rosetta approach takes advantage of the first, but not the second source of information during model optimization. Following the classic work by Andrej Sali and colleagues, we develop a probabilistic approach to derive spatial restraints from proteins of known structure using advances in alignment technology and the growth in the number of structures in the Protein Data Bank. These restraints define a region of conformational space that is high-probability, given the template information, and we incorporate them into Rosetta's comparative modeling protocol. The combined approach performs considerably better on a benchmark based on previous CASP experiments. Incorporating evolutionary information into Rosetta is analogous to incorporating sparse experimental data: in both cases, the additional information eliminates large regions of conformational space and increases the probability that energy-based refinement will hone in on the deep energy minimum at the native state.


Figures

Figure 1
Figure 1
Dependence of distance deviations on individual features. Conditional probability distributions were calculated using the features and approach outlined in Methods section, which follows the Modeller approach for deriving distance restraints. Each panel shows the distribution of distance deviations conditioned on a single feature (A—global sequence similarity, B—local sequence similarity, C—burial in the template structure, and D—distance from an alignment gap). Lines represent the distribution of deviations for quantiles of the feature (red, 0–25%; orange, 26–50%; green, 51–75%; blue, 76–100%). Boundaries that define quantiles for each variable are listed in Supporting Information Table SI.
Figure 2
Figure 2
Model evaluation based on likelihood of independent test set. A: Illustration of model evaluation with distance predictions based on two Gaussians. Both Gaussians have a mean of 7.0 Å and a standard deviation of 1.0 (solid line) or 2.0 Å (dashed line). If the native distance occurs at 6.5 Å, the sharper Gaussian (solid line) is a better model. If the native distance occurs at 9.5 Å, the wider Gaussian (dashed line) is a better model. B: Different models were assessed based on the likelihood of distances from an independent set of aligned proteins. Each bar shows the likelihood of sampling a set of atom-pair distances using a fixed set of alignments and different variables to construct the models. The letters below each bar list the input features used to construct the model (B—burial in template structure, L—local sequence similarity, D— distance from a gap, and G—global sequence similarity). The prior model is a Gaussian model based only on sequence separation of the residues in the linear sequence (see Methods section) and is shown here as a negative control. The middle four bars show the performance of models based on single features, while the final three bars represent models based on two, three, and four features. All four single-variable models out-perform the prior model. Adding predictors to each model improve the likelihood of sampling the native atom-pair distance, which supports the use of all four variables in estimating deviations from template structures.
Figure 3
Figure 3
Likelihood increases using weighted predictions from multiple templates. Each bar represents the likelihood (negative log-probability) of sampling the native distance between two Cα atoms under different Gaussian mixture models. A: Gaussians were derived using the approach outlined in Methods section and evaluated using the likelihood test outlined in Figure 2, and Gaussians restraining the same pair of atoms were combined to produce a Gaussian mixture model. The probability of sampling the native distance was calculated from the resulting probability distribution. Each bar plots the negative log-likelihood of sampling the native distance, which decreases as predictions become more accurate. Shaded bars represent a model in which all predictions are given equal weight, and open bars represent a model in which predictions are given a weight proportional to sd–10. B: Probabilistic models are compared using the likelihood test outlined in Figure 2. Prior is a Gaussian model that models query distances based solely on the sequence separation between residues in the query sequence, fixed_harmonic is a Gaussian mixture model that assigns a fixed-width standard deviation to each template’s prediction and an equal weight for each prediction, unweighted represents a model with standard deviations given by the predictor described in Methods section and an equal weight for each prediction, and weighted is a model with standard deviations estimated by the same predictor and weights estimated as a function of that standard deviation. The perfect_classifier model represents a model that adjusts weights for each prediction in order to maximize the probability of observing the native distance, and perfect_knowledge represents a model in which the query distances are modeled using a Gaussian model with a standard deviation of 1.0 Å.
Figure 4
Figure 4
Full-atom energy and homology-derived spatial restraints distinguish between models in different accuracy regimes. We constructed models for a protein of unknown structure during the CASP9 experiment (CASP9 target T0569). Models were made using the Rosetta rebuild and refine protocol supplemented with the evolutionary restraints as described in Methods section. After obtaining the experimentally determined structure of T0569, we calculated the GDTMM of each model, which approaches 1.0 as a model become more similar to the native (Supporting Information Text 4). The same statistics were calculated for an ensemble of Rosetta refined native structures. Models were assigned to GDTMM bins, which ranged from 0.1 to 1.0 in. increments of 0.1. In each plot, the points connected by lines represent the statistics calculated on each bin, and the gray, red, and blue points represent individual structures. A: Median GDTMM versus median Rosetta full-atom score, with a circle surrounding the bin containing the refined native structures. B: Median GDTMM versus median spatial restraint score. The Rosetta full-atom energy is very effective at discriminating the high-quality from medium-quality models, while less effective at discriminating medium-quality from low-quality models. Conversely, the restraints discriminate medium-quality from low-quality models very well, but are not effective at discriminating high-quality models from natives and can even provide a barrier to sampling the native conformation. C: A combination of the two scores is effective at discrimination independent of model quality.

References

    1. Chothia C, Lesk AM. The relation between the divergence of sequence and structure in proteins. EMBO J. 1986;5:823–826. - PMC - PubMed
    1. Levitt M. Growth of novel protein structural data. Proc Natl Acad Sci USA. 2007;104:3183–3188. - PMC - PubMed
    1. Sali A, Blundell TL. Comparative protein modelling by satisfaction of spatial restraints. J Mol Biol. 1993;234:779–815. - PubMed
    1. Wang G, Dunbrack RL., Jr PISCES: a protein sequence culling server. Bioinformatics. 2003;19:1589–1591. - PubMed
    1. Söding J. Protein homology detection by HMM-HMM comparison. Bioinformatics. 2005;21:951–960. - PubMed

LinkOut - more resources