. 2011 Jun 3:12:290.
doi: 10.1186/1471-2164-12-290.

A honey bee (Apis mellifera L.) PeptideAtlas crossing castes and tissues

Affiliations

A honey bee (Apis mellifera L.) PeptideAtlas crossing castes and tissues

Queenie W T Chan et al. BMC Genomics. .

Abstract

Background: Honey bees are a mainstay of agriculture, contributing billions of dollars through their pollination activities. Bees have been a model system for sociality and group behavior for decades but only recently have molecular techniques been brought to study this fascinating and valuable organism. With the release of the first draft of its genome in 2006, proteomics of bees became feasible and over the past five years we have amassed in excess of 5E+6 MS/MS spectra. The lack of a consolidated platform to organize this massive resource hampers our ability, and that of others, to mine the information to its maximum potential.

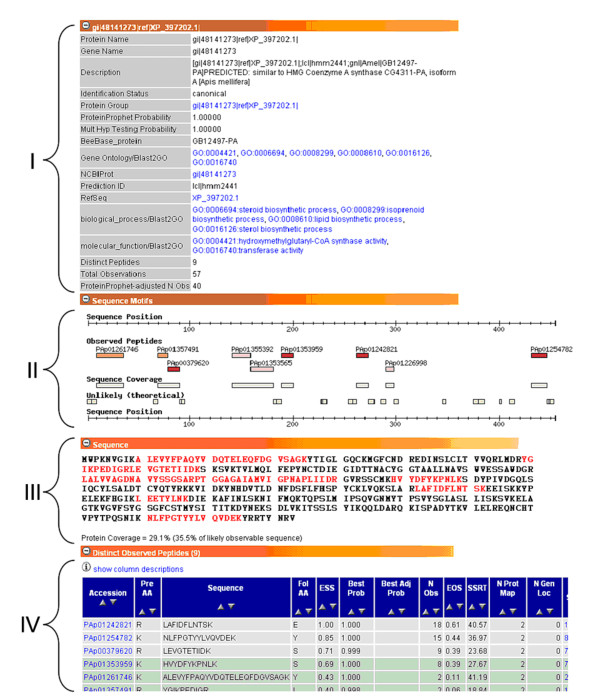
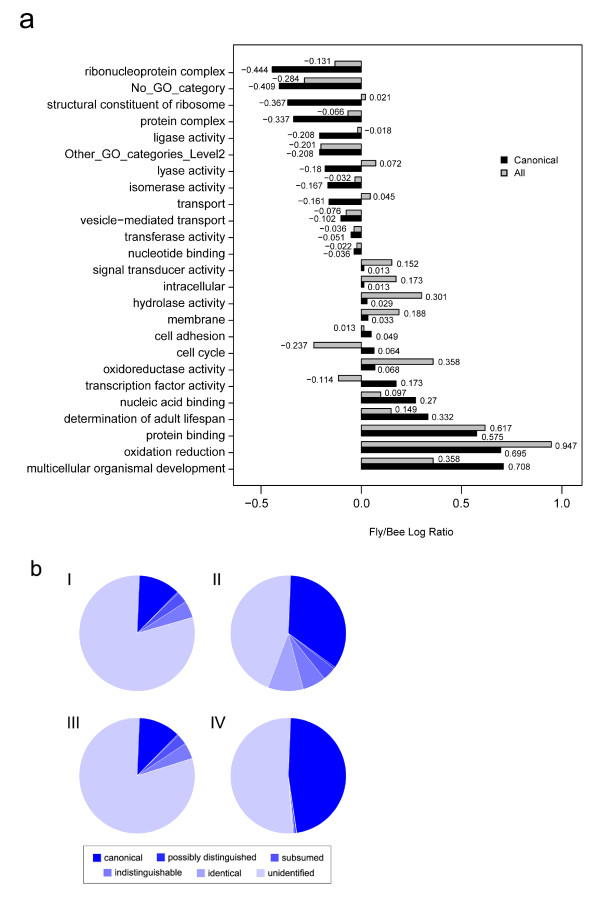
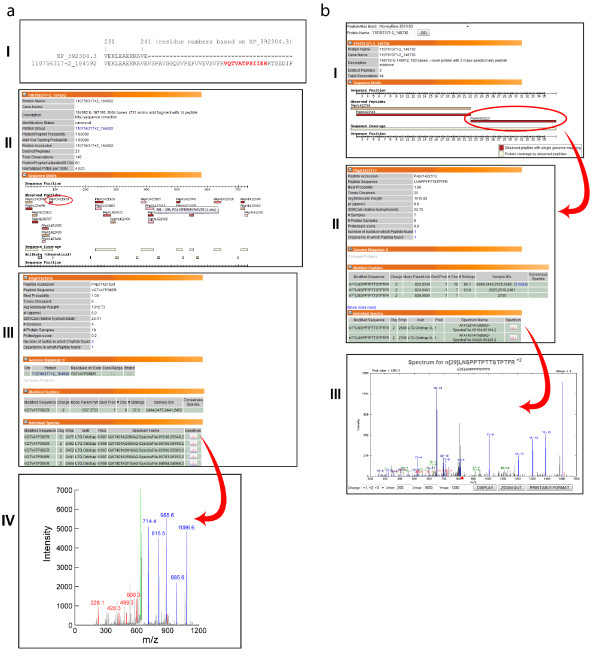
Results: Here we introduce the Honey Bee PeptideAtlas, a web-based resource for visualizing mass spectrometry data across experiments, providing protein descriptions and Gene Ontology annotations where possible. We anticipate that this will be helpful in planning proteomics experiments, especially in the selection of transitions for selected reaction monitoring. Through a proteogenomics effort, we have used MS/MS data to anchor the annotation of previously undescribed genes and to re-annotate previous gene models in order to improve the current genome annotation.

Conclusions: The Honey Bee PeptideAtlas will contribute to the efficiency of bee proteomics and accelerate our understanding of this species. This publicly accessible and interactive database is an important framework for the current and future analysis of mass spectrometry data.


Figures

Figure 1
Figure 1
Creating the Honey Bee PeptideAtlas. Honey bee tissues of different ages, sexes, and disease states were analyzed by MS using the high accuracy LTQ-OrbitrapXL or LTQ-FT. To improve proteome depth, we used samples which were biological replicates (i.e. same experiment on more than one bee), technical replicates (i.e. one bee sample analyzed more than once by MS), and employed various fractionation techniques. The RAW files were put through the PeptideAtlas pipeline. The database used for searching the MS data contained sequences from various publicly available sources, as well as novel and corrected proteins derived from the proteogenomics effort reported in this article. Using BLAST2GO, GO terms were annotated to proteins where appropriate. This result of this work comprises the Honey Bee PeptideAtlas.
Figure 2
Figure 2
Plot showing the cumulative number of distinct peptides added to the Honey Bee PeptideAtlas versus the total number of peptide-spectrum matches (PSMs) about the 0.0001 FDR threshold. Each rectangle represents one of the 253 samples in the atlas. The height of each bar is the cumulative number of distinct peptides a sample is added; the blue component is number of distinct peptides in each sample. The width of the bar denotes the number of PSMs identified above the threshold for each sample. Groups of similar samples cause the cumulative number of distinct peptides to level off, but as a new sample type is added, the number of additional distinct peptides added to the build increases significantly.
Figure 3
Figure 3
Screenshot of a protein view within PeptideAtlas for protein GB12497-PA. The general protein view has several collapsible sections that provide information about the protein. Section I provides known aliases and descriptions of the protein including functional annotations from our BLAST2GO results, while Section II depicts the distribution of observed and unlikely peptides in a graphical format. Section III shows the full amino acid sequence with observed parts colored in red. Section IV lists individual observed peptides and their attributes.
Figure 4
Figure 4
Screenshot of a PeptideAtlas sequence alignment of three similar proteins. The sequences are aligned with ClustalW, whose consensus string is show below the sequences; an asterisk indicates identity for all proteins. Sequence is colored blue or green where observed peptides are seen. There is no independent evidence that the top protein is detected, while there is significant evidence that the bottom form is detected.
Figure 5
Figure 5
Comparing the honey bee and fruit fly. (a) Chart showing the relative occurrences of GO terms for honey bee and fruit fly. Each bar represents the log ratio of the number of proteins annotated with a given category for fly vs. bee. Black bars represent observed proteins in PeptideAtlas; Grey bars represent all annotated proteins. (b) Pie charts representing protein (I, II) and gene (III, IV) coverage in the Honey Bee (I, III) and Fly (II, IV) PeptideAtlases.
Figure 6
Figure 6
Annotation and reannotation of bee genes. MS2 data were searched against a 6-frame translation of all ORFs from the honey bee genome, ignoring matches to contaminants, partial/non-tryptic, short (≤ 5 residues), and end-of-sequence peptides. Peptides that match already annotated proteins are in ➀, and those that did not are in ➁. In ➂, the ORFs matched by ➁ were compiled. In ➃, we tested which peptides can be matched to the ORFs in ➂. The ORFs which are matched only by peptides of ➁ are novel proteins (➄). The ORFs which are matched by peptides from both ➀ and ➁ are corrections of already annotated proteins (➅); most commonly, these were residues that had previously been falsely classified as introns, where current MS spectra now confirm their expression. "GROUP A" and "GROUP B" proteins refer to corrected and new proteins, respectively (see manuscript text).
Figure 7
Figure 7
Example of a corrected protein sequence, using MS-detected peptide as evidence, with screenshots from the PeptideAtlas user interface. (I) The sequence of XP_392304.3, which is the current version available publicly, is interrupted by an apparent intron after residue 242. However, when searching MS data against a set of ORFs derived from six-frame translations of the bee genome, the peptide VQTVATPSIIER was found only 21 residues C-terminally from residue 242, within what was originally thought to be an intron. (II) Using the PeptideAtlas interface, one can visualize the location of the peptide (circled in red) with respect to the whole protein, (III) explore the frequency of observations of the peptide, and (IV) view the individual spectrum pertaining to each observation. Figure 7b. Example of a new protein, using MS-detected peptide as evidence, with screenshots from the PeptideAtlas user interface. (I) The sequence 110761371-2_148730 is an ORF that is not part of the annotated honey bee protein database, yet is matched by three unique peptides. Clicking on any peptide, for example PAp01422113 (circled in red), reveals the sequence itself (LNSPPTPTTSTPTFR - see II), the frequency of observations and more precisely, the samples that contain the peptide spectrum. (III) After clicking on the spectrum icon for any of the samples, the relevant spectrum is shown.

References

    1. Consortium THGS. Insights into social insects from the genome of the honeybee Apis mellifera. Nature. 2006;443(7114):931–49. doi: 10.1038/nature05260. - DOI - PMC - PubMed
    1. Elsik CG, Mackey AJ, Reese JT, Milshina NV, Roos DS, Weinstock GM. Creating a honey bee consensus gene set. Genome Biol. 2007;8(1):R13. doi: 10.1186/gb-2007-8-1-r13. - DOI - PMC - PubMed
    1. Jaffe JD, Berg HC, Church GM. Proteogenomic mapping as a complementary method to perform genome annotation. Proteomics. 2004;4(1):59–77. doi: 10.1002/pmic.200300511. - DOI - PubMed
    1. Payne SH, Huang ST, Pieper R. A proteogenomic update to Yersinia: enhancing genome annotation. BMC Genomics. 2010;11:460. - PMC - PubMed
    1. Chan QW, Melathopoulos AP, Pernal SF, Foster LJ. The innate immune and systemic response in honey bees to a bacterial pathogen, Paenibacillus larvae. BMC Genomics. 2009;10:387. doi: 10.1186/1471-2164-10-387. - DOI - PMC - PubMed

Publication types

Substances

LinkOut - more resources