

Discriminating schizophrenia and bipolar disorder by fusing fMRI and DTI in a multimodal CCA+ joint ICA model
- PMID: 21640835
- PMCID: PMC3129373
- DOI: 10.1016/j.neuroimage.2011.05.055
Discriminating schizophrenia and bipolar disorder by fusing fMRI and DTI in a multimodal CCA+ joint ICA model
Abstract
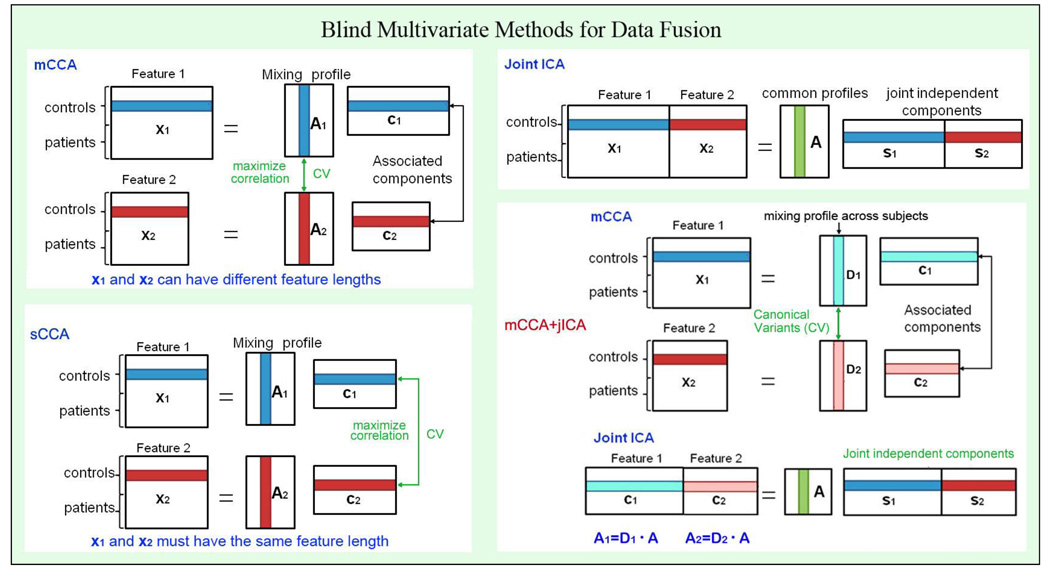
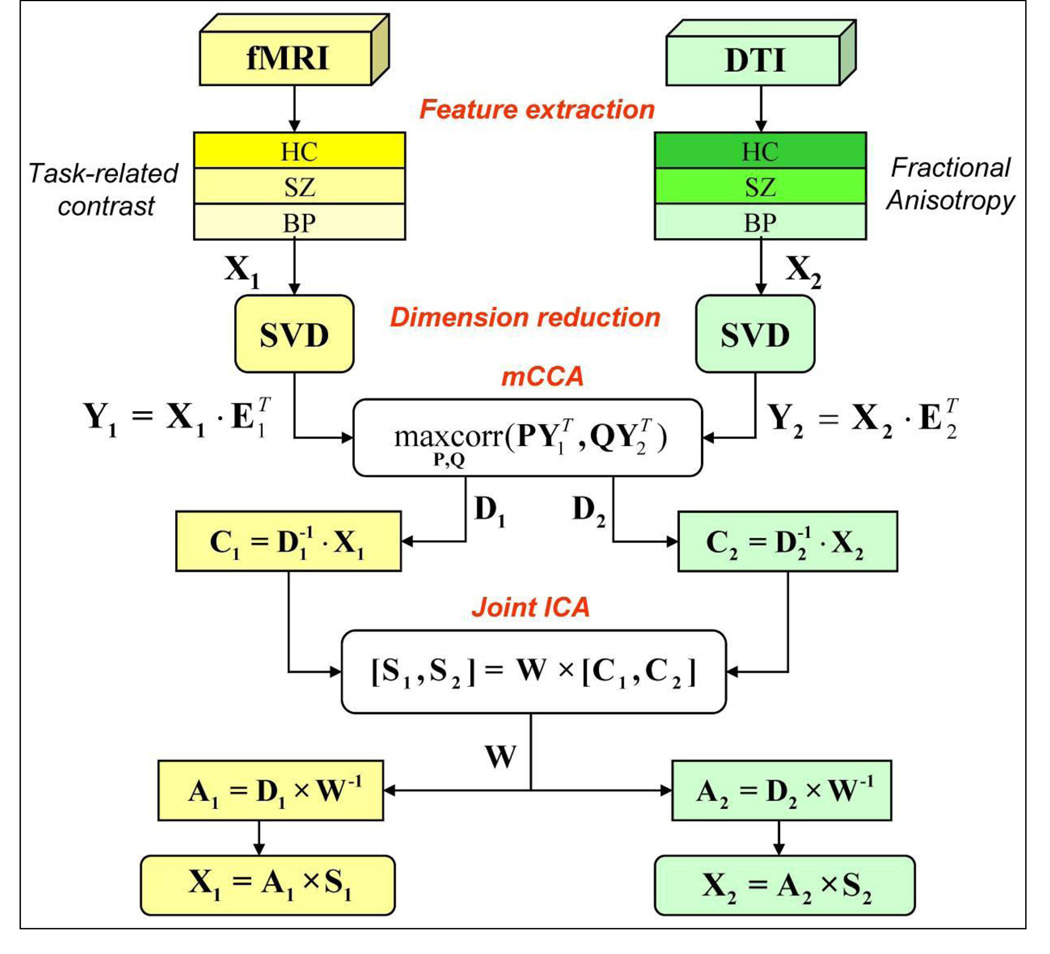
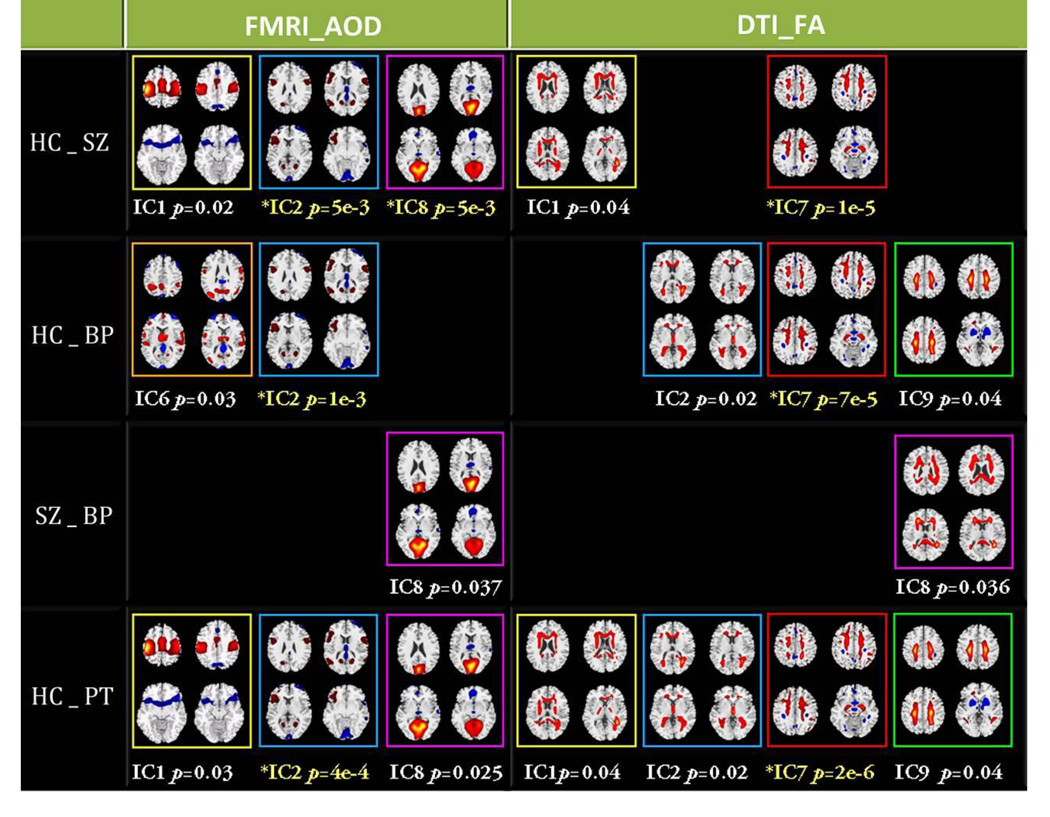
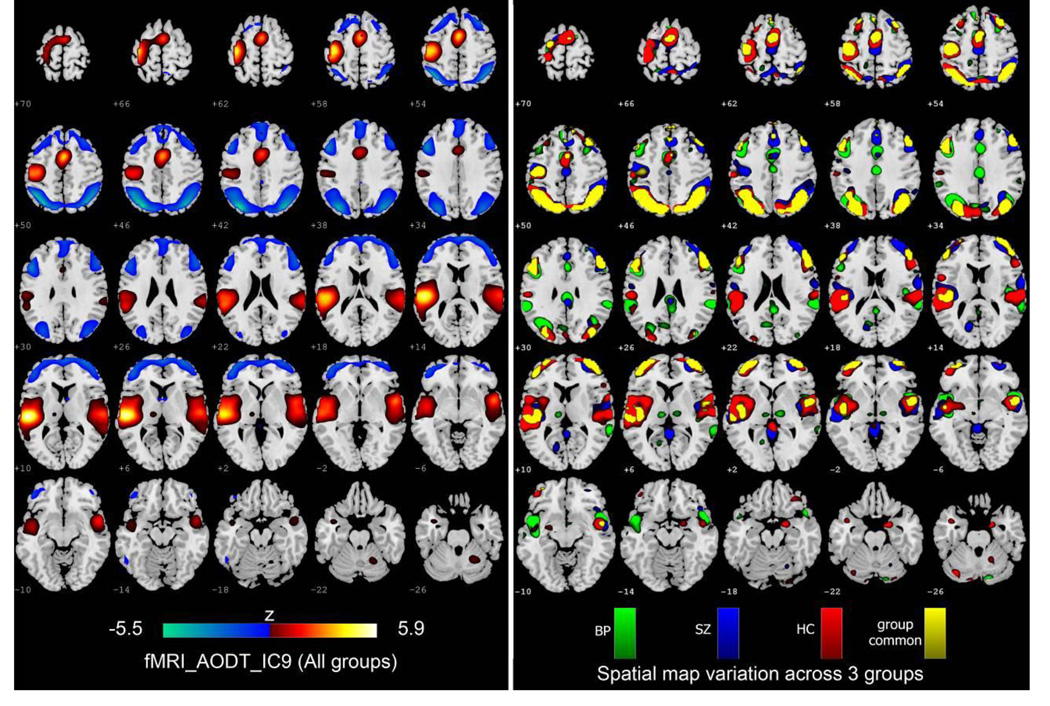
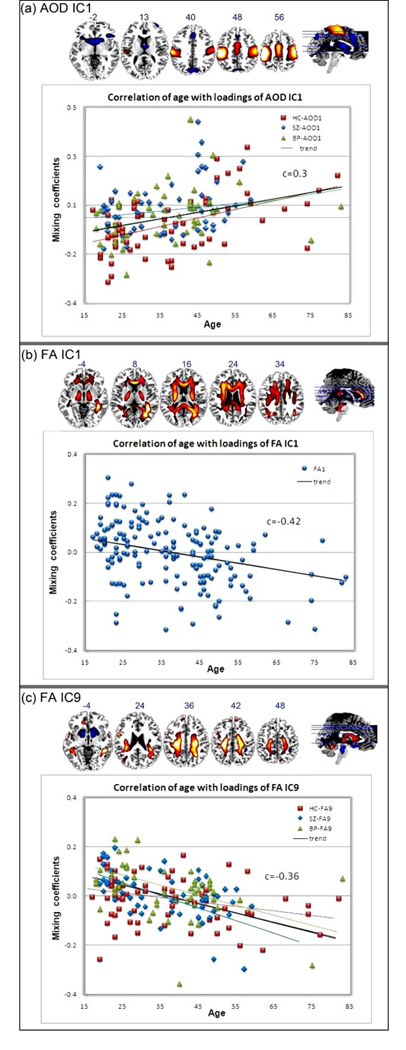
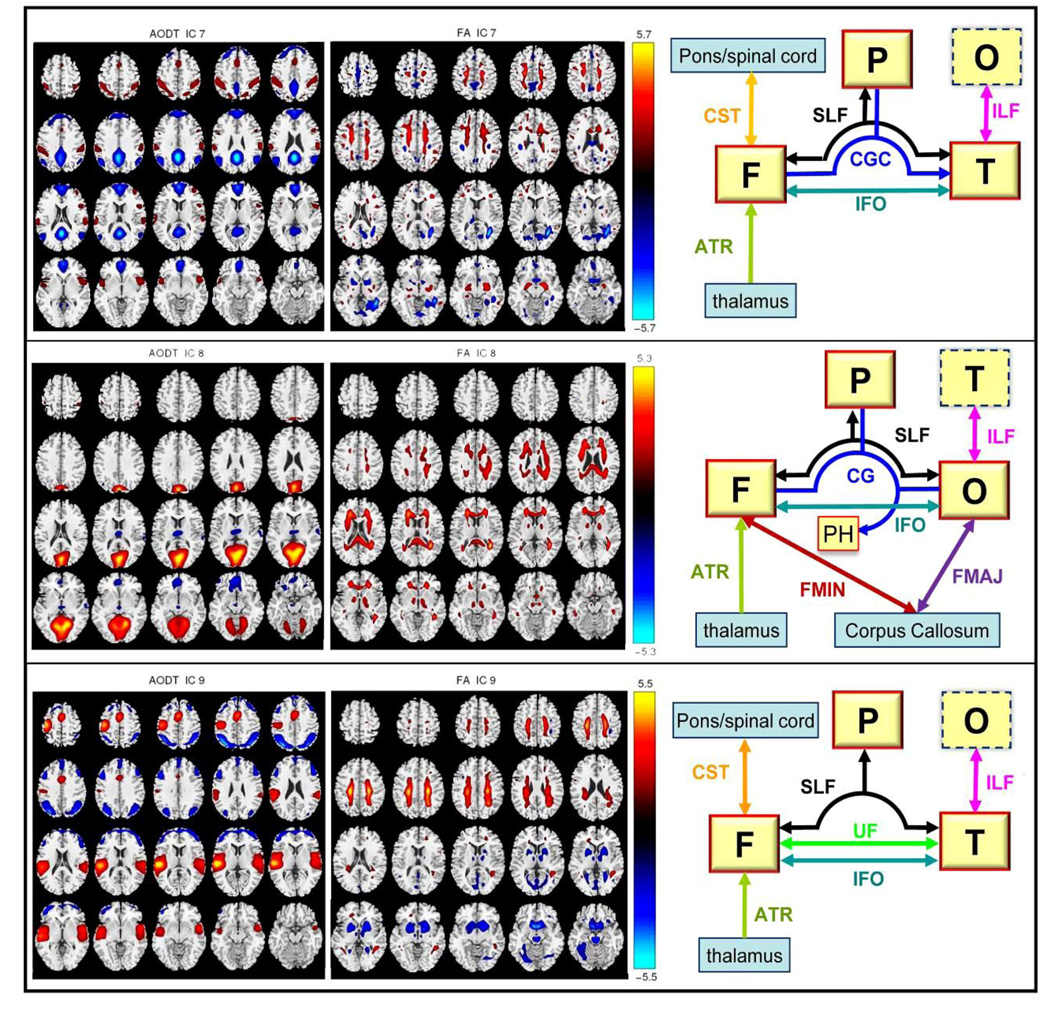
Diverse structural and functional brain alterations have been identified in both schizophrenia and bipolar disorder, but with variable replicability, significant overlap and often in limited number of subjects. In this paper, we aimed to clarify differences between bipolar disorder and schizophrenia by combining fMRI (collected during an auditory oddball task) and diffusion tensor imaging (DTI) data. We proposed a fusion method, "multimodal CCA+ joint ICA", which increases flexibility in statistical assumptions beyond existing approaches and can achieve higher estimation accuracy. The data collected from 164 participants (62 healthy controls, 54 schizophrenia and 48 bipolar) were extracted into "features" (contrast maps for fMRI and fractional anisotropy (FA) for DTI) and analyzed in multiple facets to investigate the group differences for each pair-wised groups and each modality. Specifically, both patient groups shared significant dysfunction in dorsolateral prefrontal cortex and thalamus, as well as reduced white matter (WM) integrity in anterior thalamic radiation and uncinate fasciculus. Schizophrenia and bipolar subjects were separated by functional differences in medial frontal and visual cortex, as well as WM tracts associated with occipital and frontal lobes. Both patients and controls showed similar spatial distributions in motor and parietal regions, but exhibited significant variations in temporal lobe. Furthermore, there were different group trends for age effects on loading parameters in motor cortex and multiple WM regions, suggesting that brain dysfunction and WM disruptions occurred in identified regions for both disorders. Most importantly, we can visualize an underlying function-structure network by evaluating the joint components with strong links between DTI and fMRI. Our findings suggest that although the two patient groups showed several distinct brain patterns from each other and healthy controls, they also shared common abnormalities in prefrontal thalamic WM integrity and in frontal brain mechanisms.
Copyright © 2011 Elsevier Inc. All rights reserved.
Figures
References
-
- Alexander GE, Crutcher MD, DeLong MR. Basal ganglia-thalamocortical circuits: parallel substrates for motor, oculomotor, "prefrontal" and "limbic" functions. Prog Brain Res. 1990;85:119–146. - PubMed
-
- Altshuler LL, Bartzokis G, Grieder T, Curran J, Jimenez T, Leight K, Wilkins J, Gerner R, Mintz J. An MRI study of temporal lobe structures in men with bipolar disorder or schizophrenia. Biol Psychiatry. 2000;48(2):147–162. - PubMed
-
- Andersen RA, Buneo CA. Intentional maps in posterior parietal cortex. Annu Rev Neurosci. 2002;25:189–220. - PubMed
Publication types
MeSH terms
Grants and funding
- R01 MH072681/MH/NIMH NIH HHS/United States
- R01EB 005846/EB/NIBIB NIH HHS/United States
- R01 EB006841/EB/NIBIB NIH HHS/United States
- R01MH074797/MH/NIMH NIH HHS/United States
- R01 EB000840/EB/NIBIB NIH HHS/United States
- R01MH077945/MH/NIMH NIH HHS/United States
- R01MH43775/MH/NIMH NIH HHS/United States
- R01EB 006841/EB/NIBIB NIH HHS/United States
- R01 MH074797/MH/NIMH NIH HHS/United States
- R01 EB020407/EB/NIBIB NIH HHS/United States
- R01 MH085010/MH/NIMH NIH HHS/United States
- R01 EB005846/EB/NIBIB NIH HHS/United States
- R01MH072681-01/MH/NIMH NIH HHS/United States
- R01 MH077945/MH/NIMH NIH HHS/United States
- R01 MH043775/MH/NIMH NIH HHS/United States
LinkOut - more resources
Full Text Sources
Medical
Miscellaneous
