. 2011 Jun;178(6):2760-73.
doi: 10.1016/j.ajpath.2011.02.033.

Human leukocyte antigen class II transgenic mouse model unmasks the significant extrahepatic pathology in toxic shock syndrome

Affiliations

Human leukocyte antigen class II transgenic mouse model unmasks the significant extrahepatic pathology in toxic shock syndrome

Ashenafi Y Tilahun et al. Am J Pathol. 2011 Jun.

Abstract

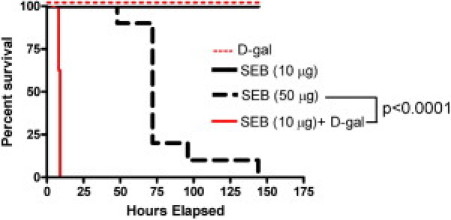
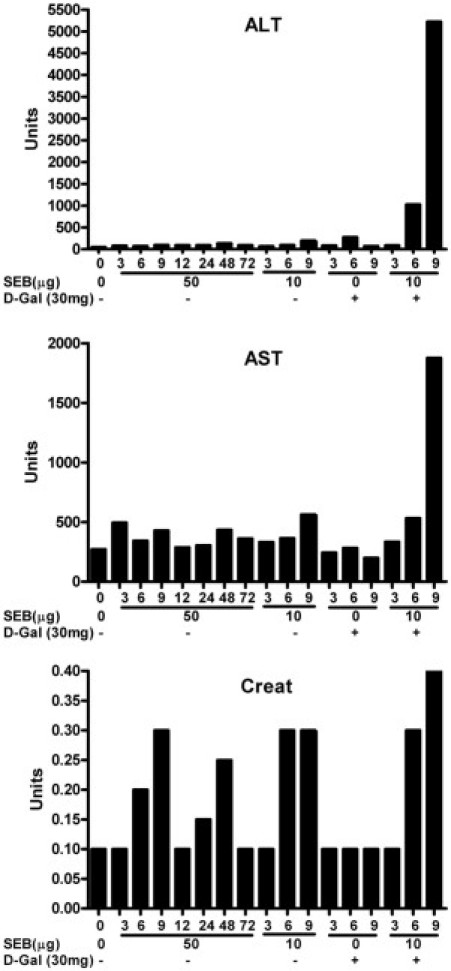
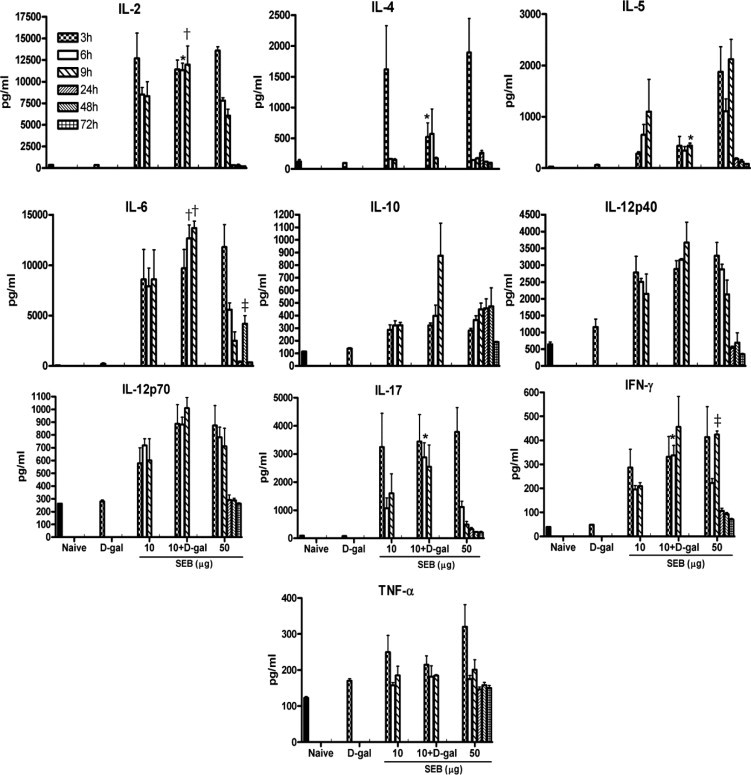
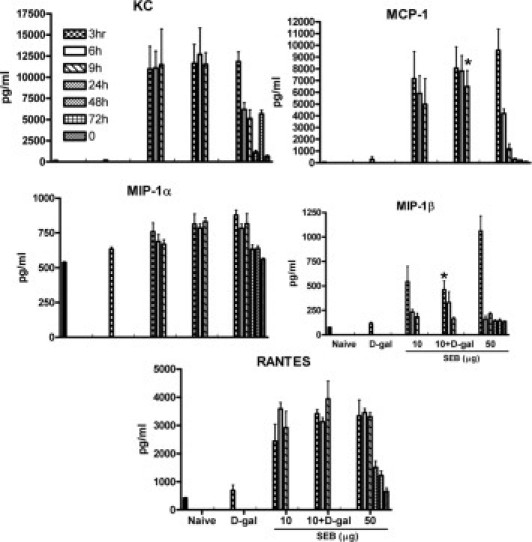
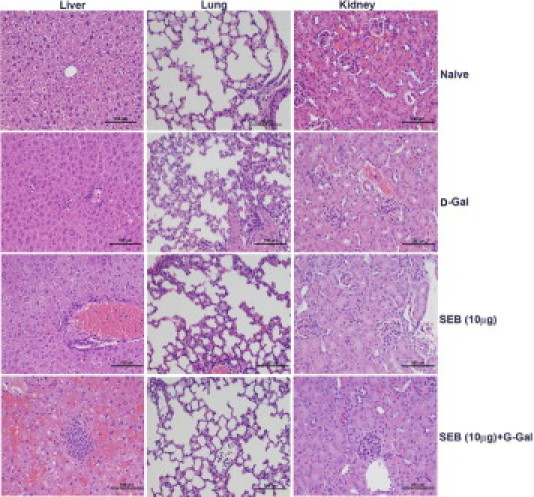
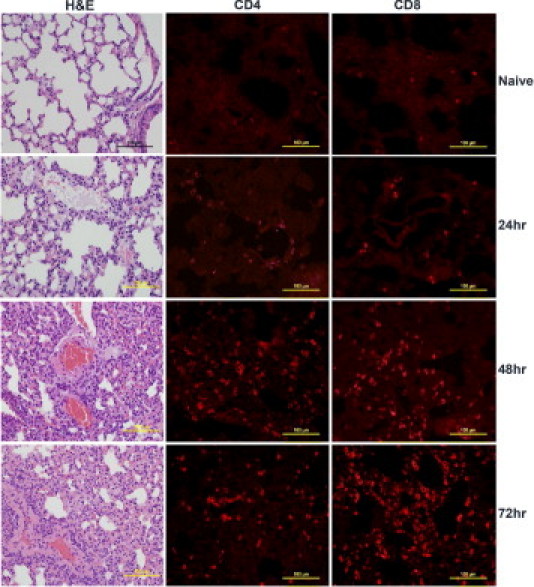
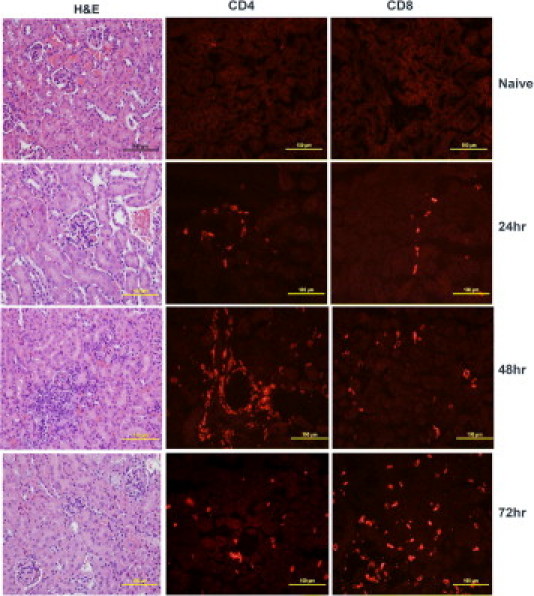
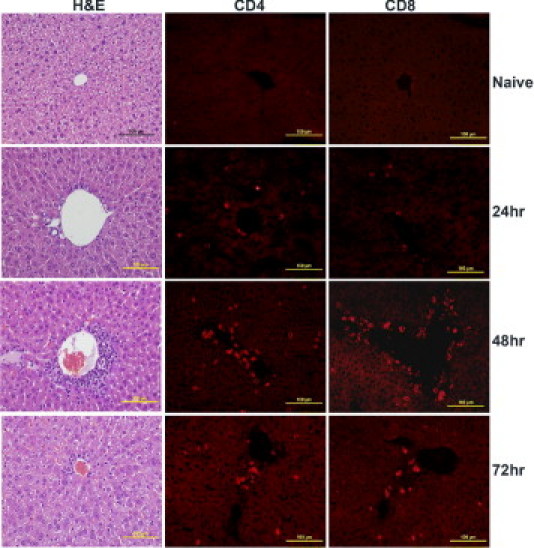
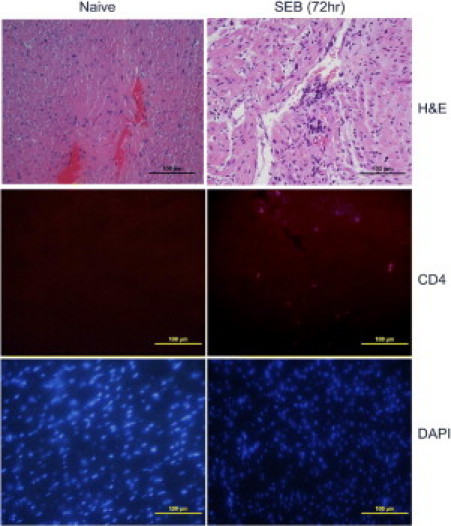
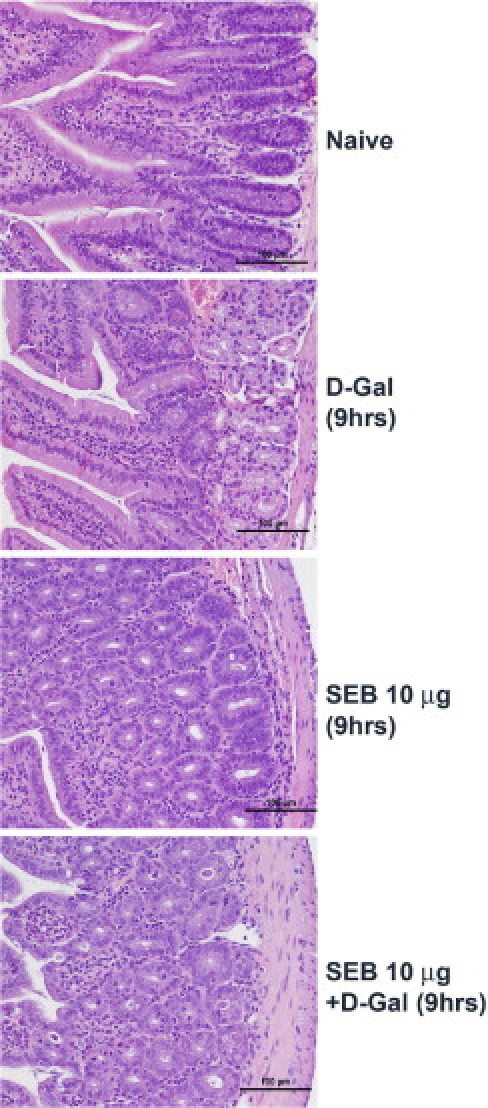
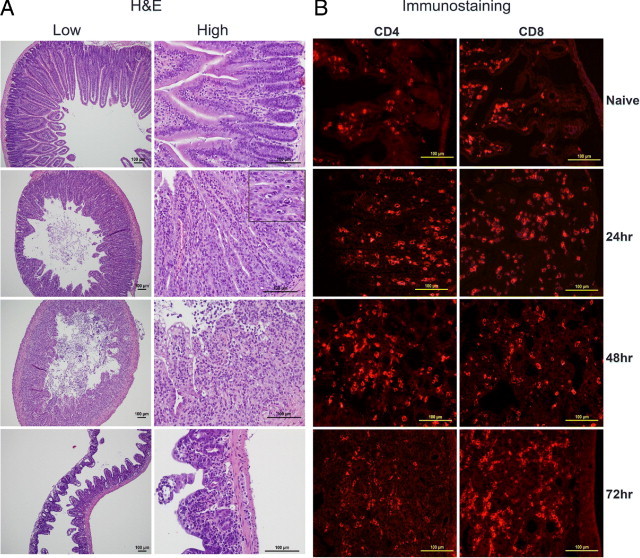
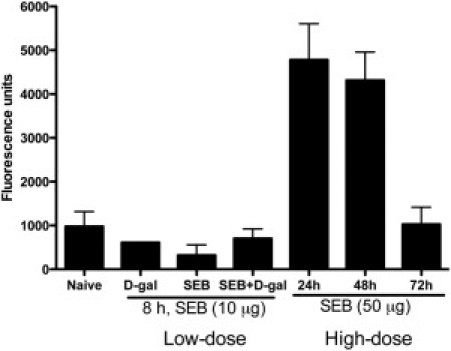
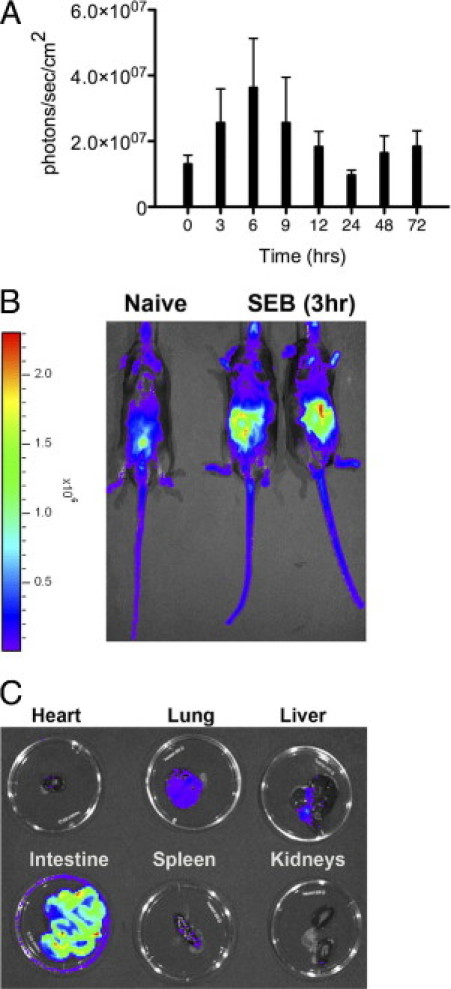
Among the exotoxins produced by Staphylococcus aureus and Streptococcus pyogenes, the superantigens (SAgs) are the most potent T-cell activators known to date. SAgs are implicated in several serious diseases including toxic shock syndrome (TSS), Kawasaki disease, and sepsis. However, the immunopathogenesis of TSS and other diseases involving SAgs are still not completely understood. The commonly used conventional laboratory mouse strains do not respond robustly to SAgs in vivo. Therefore, they must be artificially rendered susceptible to TSS by using sensitizing agents such as d-galactosamine (d-galN), which skews the disease exclusively to the liver and, hence, is not representative of the disease in humans. SAg-induced TSS was characterized using transgenic mice expressing HLA class II molecules that are extremely susceptible to TSS without d-galN. HLA-DR3 transgenic mice recapitulated TSS in humans with extensive multiple-organ inflammation affecting the lung, liver, kidneys, heart, and small intestines. Heavy infiltration with T lymphocytes (both CD4(+) and CD8+), neutrophils, and macrophages was noted. In particular, the pathologic changes in the small intestines were extensive and accompanied by significantly altered absorptive functions of the enterocytes. In contrast to massive liver failure alone in the d-galN sensitization model of TSS, findings of the present study suggest that gut dysfunction might be a key pathogenic event that leads to high morbidity and mortality in humans with TSS.


Figures

Figure 1
Figure 1
Incidence of SEB-induced mortality in HLA-DR3 transgenic mice with and without d-galN sensitization. Twelve- to 14-week-old HLA-DR3 transgenic mice (6 to 11 mice per group) were treated as indicated. Mice were monitored once every 3 hours through 9 hours, and daily thereafter. Survival curves and statistical significance were generated using PRISM software (version 3.0a; GraphPad Software Inc., San Diego, CA).
Figure 2
Figure 2
Serum biochemical changes in HLA-DR3 transgenic mice undergoing SEB-induced TSS with and without d-galN sensitization.Twelve- to 14-week-old HLA-DR3 transgenic mice were challenged as indicated. Groups of mice (three or four mice per group) were sacrificed at indicated times. Serum ALT, AST, and creatinine concentrations were determined in serum samples pooled from each group. The entire experiment was repeated at least three times, with similar results.
Figure 3
Figure 3
Temporal changes in systemic cytokine levels during SEB-induced TSS. Twelve- to 14-week-old HLA-DR3 transgenic mice were challenged as indicated. Groups of mice (four to six mice per group) were sacrificed at indicated times, and serum cytokine levels were determined using a multiplex suspension array system (Bio-Plex; Bio-Rad Laboratories, Inc., Hercules, CA). Bars represent mean ± SE values for four to six mice. Unpaired Student's t-test was used to determine statistical significance using PRISM software (version 3.0a; GraphPad Software Inc., San Diego, CA). *P < 0.05 with 10 and 50 µg SEB; P < 0.05 with 50 µg SEB; P < 0.05 with 10 µg SEB.
Figure 4
Figure 4
Temporal changes in systemic chemokine levels during SEB-induced TSS. Twelve- to 14-week-old HLA-DR3 transgenic mice were challenged as indicated. Groups of mice (four to six mice per group) were sacrificed at indicated times, and serum cytokine levels were determined using a multiplex suspension array system (Bio-Plex; Bio-Rad Laboratories, Inc., Hercules, CA). Bars represent mean ± SE values for four to six mice. Unpaired Student's t-test was used to determine statistical significance using PRISM software (version 3.0a; GraphPad Software Inc., San Diego, CA). *P < 0.05 with SEC 50 µg.
Figure 5
Figure 5
Immunopathology in d-galN–sensitized model of TSS with low-dose SEB. Twelve- to 14-week-old HLA-DR3 transgenic mice were challenged as indicated, with SEB alone, d-galN alone, or SEB+d-galN. Mice were sacrificed at 9 hours, and organs were collected in buffered formalin and processed for H&E staining. Scale bars = 100 μm.
Figure 6
Figure 6
Pulmonary immunopathology in high-dose SEB-induced TSS without d-galN sensitization. Twelve- to 14-week-old HLA-DR3 transgenic mice were either untreated or challenged with 50 μg SEB. Mice were sacrificed at indicated times, and lungs were collected in either buffered formalin or OCT compound and processed for H&E or immunostaining, respectively. Scale bars = 100 μm.
Figure 7
Figure 7
Renal immunopathology in high-dose SEB-induced TSS without d-galN sensitization. Twelve- to 14-week-old HLA-DR3 transgenic mice were either untreated or challenged with 50 μg SEB. Mice were sacrificed at indicated times, and kidneys were collected in either buffered formalin or OCT compound and processed for H&E or immunostaining, respectively. Scale bars = 100 μm.
Figure 8
Figure 8
Hepatic immunopathology in high-dose SEB-induced TSS without d-galN sensitization. Twelve- to 14-week-old HLA-DR3 transgenic mice were either untreated or challenged with 50 μg SEB. Mice were sacrificed at indicated times, and livers were collected in either buffered formalin or OCT compound and processed for H&E or immunostaining, respectively. Scale bars = 100 μm.
Figure 9
Figure 9
Cardiac immunopathology in high-dose SEB-induced TSS without d-galN sensitization. Twelve- to 14-week-old HLA-DR3 transgenic mice were either untreated or challenged with 50 μg SEB. Mice were sacrificed at various time, and hearts were collected in either buffered formalin or OCT compound and processed for H&E or immunostaining, respectively. Figure shows heart collected at 72 hours. Scale bars = 100 μm.
Figure 10
Figure 10
Intestinal disease in d-galN–sensitized model of TSS with low-dose SEB. Twelve- to 14-week-old HLA-DR3 transgenic mice were challenged as indicated with SEB alone, d-galN alone, or SEB+d-galN. Mice were sacrificed at 9 hours, and small intestines were collected in buffered formalin and processed for H&E staining. Scale bars = 100 μm.
Figure 11
Figure 11
Intestinal immunopathology in high-dose SEB-induced TSS without d-galN sensitization. Twelve- to 14-week-old HLA-DR3 transgenic mice were either untreated or challenged with 50 μg SEB. Mice were sacrificed at indicated times, and small intestines were collected in either buffered formalin or OCT compound and processed for H&E (A) or immunostaining (B). Scale bars = 100 μm.
Figure 12
Figure 12
Altered gut permeability in HLA-DR3 transgenic mice during high-dose SEB-induced TSS without d-galN sensitization. Twelve- to 14-week-old HLA-DR3 transgenic mice were either untreated or treated as indicated. Mice underwent gavage using FITC-dextran (see Materials and Methods). Three hours after gavage, mice were sacrificed, serum samples were collected, and the fluorescence in the serum was determined at 490 nm excitation and 525 nm emission in duplicate. Representative results from one of three similar experiments are shown. Scale bars represent mean ± SE values for two mice in each group.
Figure 13
Figure 13
In vivo imaging of inflammatory changes in real-time during TSS using Luc transgenic mice. Twelve- to 14-week-old DR3.Luc transgenic mice were either untreated or challenged with 50 μg SEB. At indicated times, mice were injected intraperitoneally with d-luciferin. After 12 to 15 minutes, anesthetized mice were transferred to the imaging chamber and imaged. A: Mean ± SE values for four mice. Results are from one of three similar experiments. B: Whole mouse. C: Individual organs were harvested at 3 hours and placed in small Petri dishes for imaging.

Similar articles

Cited by

References

    1. Brooks G.F., Carroll K.C., Butel J.S., Morse S.A., editors. The staphylococci. Jawetz, Melnick, & Adelberg’s Medical Microbiology. ed 25. The McGraw-Hill Companies, Inc; New York: 2010. ch 13.
    1. Manders S.M. Toxin-mediated streptococcal and staphylococcal disease. J Am Acad Dermatol. 1998;39:383–398. - PubMed
    1. Fraser D.J., Proft T. The bacterial superantigen and superantigen-like proteins. Immunol Rev. 2008;225:226–243. - PubMed
    1. Dinges M.M., Orwin P.M., Schlievert P.M. Exotoxins of Staphylococcus aureus. Clin Microbiol Rev. 2000;13:16–34. - PMC - PubMed
    1. Li H., Llera A., Malchiodi E.L., Mariuzza R.A. The structural basis of T cell activation by superantigens. Annu Rev Immunol. 1999;17:435–466. - PubMed

Publication types

MeSH terms