. 2011 Jun 8;13(6):729-38.
doi: 10.1016/j.cmet.2011.03.019.

FGF15/19 regulates hepatic glucose metabolism by inhibiting the CREB-PGC-1α pathway

Affiliations

FGF15/19 regulates hepatic glucose metabolism by inhibiting the CREB-PGC-1α pathway

Matthew J Potthoff et al. Cell Metab. .

Abstract

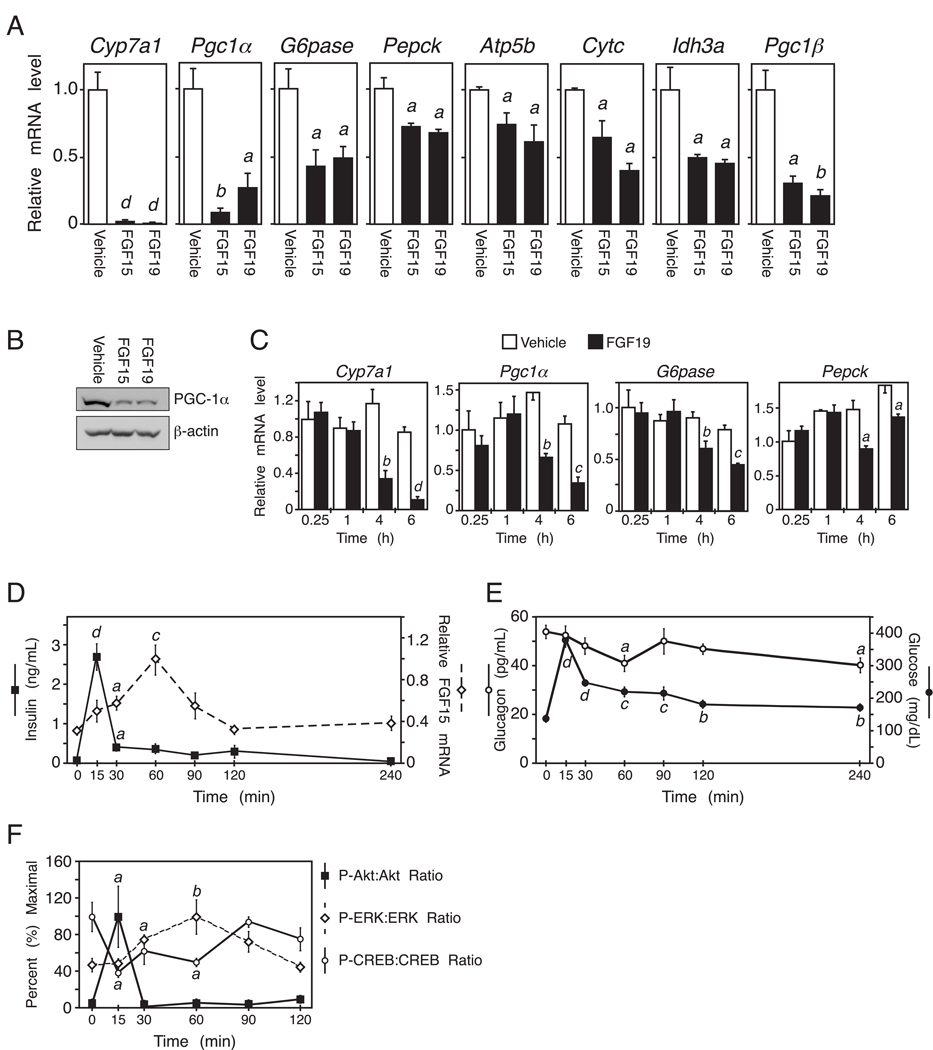
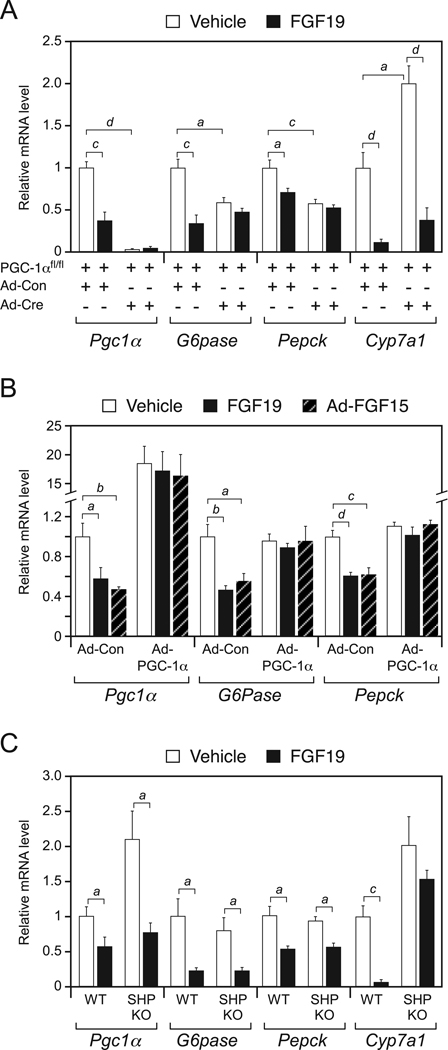
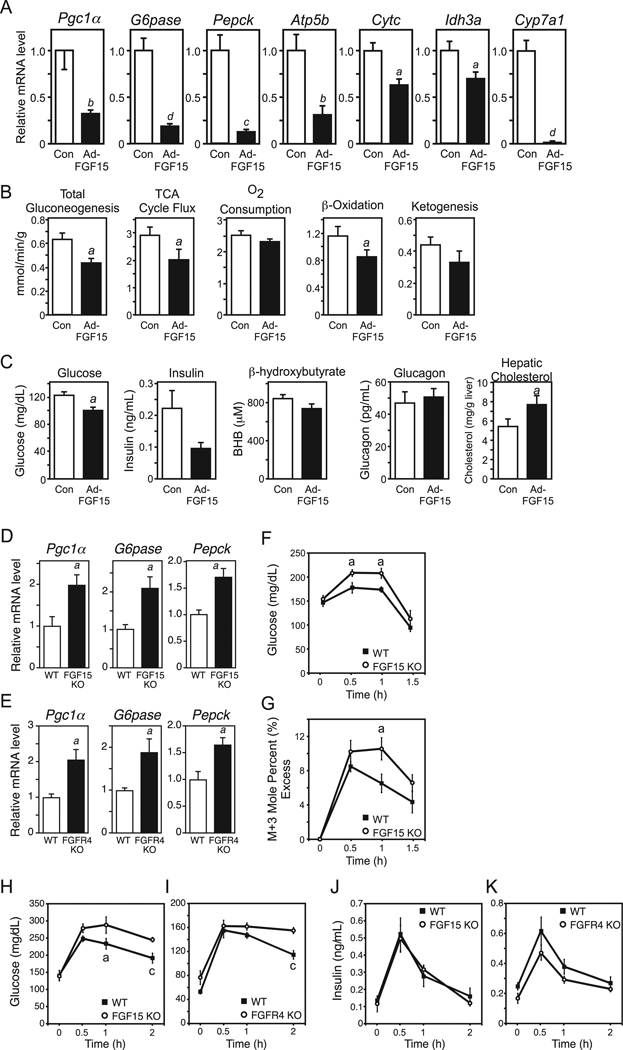
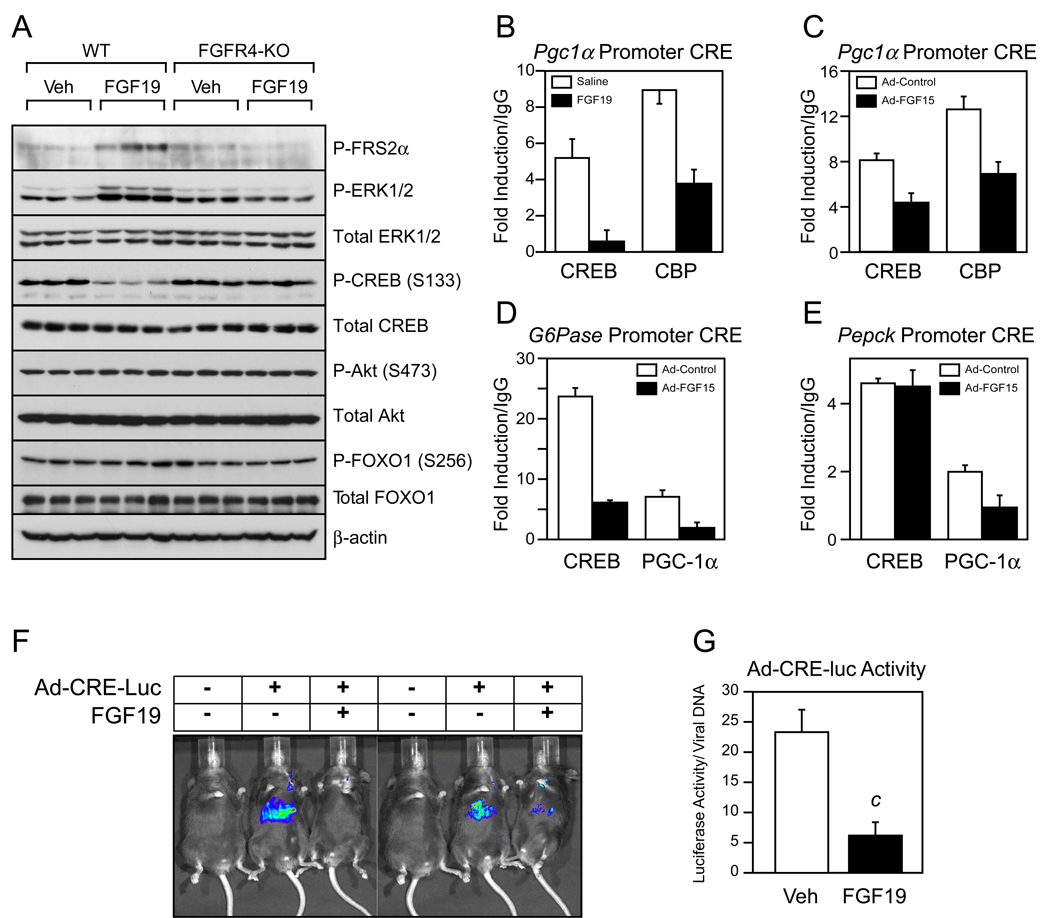
Regulation of hepatic carbohydrate homeostasis is crucial for maintaining energy balance in the face of fluctuating nutrient availability. Here, we show that the hormone fibroblast growth factor 15/19 (FGF15/19), which is released postprandially from the small intestine, inhibits hepatic gluconeogenesis, like insulin. However, unlike insulin, which peaks in serum 15 min after feeding, FGF15/19 expression peaks approximately 45 min later, when bile acid concentrations increase in the small intestine. FGF15/19 blocks the expression of genes involved in gluconeogenesis through a mechanism involving the dephosphorylation and inactivation of the transcription factor cAMP regulatory element-binding protein (CREB). This in turn blunts expression of peroxisome proliferator-activated receptor γ coactivator-1α (PGC-1α) and other genes involved in hepatic metabolism. Overexpression of PGC-1α blocks the inhibitory effect of FGF15/19 on gluconeogenic gene expression. These results demonstrate that FGF15/19 works subsequent to insulin as a postprandial regulator of hepatic carbohydrate homeostasis.


Figures

Figure 1
Figure 1. FGF15/19 represses PGC-1α and gluconeogenic gene expression
(A) Hepatic gene expression measured by QPCR in mice treated with vehicle, FGF15 or FGF19 for 6 hr (n = 4/group). Mice were fasted during the treatment period. (B) Western blot analysis of PGC-1α in liver homogenates pooled from groups of 4 mice treated with vehicle, FGF15 or FGF19 as in (A). (C) Hepatic gene expression measured by QPCR in overnight fasted mice injected with FGF19 for the indicated times (n = 4/group). (D) Ileum Fgf15 mRNA and plasma insulin levels from fasted-refed mice at the indicated times after refeeding (n = 5/group). (E) Plasma glucose and glucagon levels from fasted-refed mice at the indicated times after refeeding (n = 5/group). (F) Quantification of hepatic phospho-Akt/total Akt, phospho-ERK1/2/total ERK1/2, and phospho-CREB/total CREB from fasted-refed mice at the indicated times after refeeding (n = 4/group). Data are shown as percent of maximal phosphorylation for each protein and represent the mean ± SEM. Different lowercase letters indicate statistical significance (a, P< 0.05; b, P< 0.01; c, P< 0.005; and d, P< 0.001 versus control). See also Fig. S1.
Figure 2
Figure 2. PGC-1α, but not SHP, is required for FGF15/19 regulation of metabolic gene expression
(A) Hepatic gene expression analyzed by QPCR in groups of PGC-1afl/fl mice administered control (Ad-Con) or Cre-expressing (Ad-Cre) adenovirus and subsequently administered vehicle or FGF19 for 6 hr (n = 5–6/group). Mice were fasted during the treatment period. (B) Hepatic gene expression analyzed by QPCR in groups of wild-type (WT) mice infected with Ad-Con or PGC-1α-expressing adenovirus (Ad-PGC-1α) and subsequently administered vehicle or FGF19 for 6 hr. Mice were fasted during the treatment period. Subgroups of the Ad-Con and Ad-PGC-1α groups were co-administered an FGF15-expressing adenovirus (Ad-FGF15). All mice were fasted during the last 6 hr of the experiment (n = 5–7/group). (C) Hepatic gene expression analyzed by QPCR in groups of WT and SHP-KO mice administered vehicle or FGF19 for 6 hr (n = 4/group). Mice were fasted during the treatment period. Data are presented as mean ± SEM (a, P< 0.05; b, P< 0.01; c, P< 0.005; d, P< 0.001).
Figure 3
Figure 3. FGF15 represses hepatic gluconeogenesis, TCA cycle flux and fatty acid oxidation
(A) Hepatic gene expression measured by QPCR in mice infected with control (Con) or FGF15-expressing adenovirus (Ad-FGF15) for 3 days and then fasted overnight (n = 5/group). (B) Metabolic pathway flux measured by NMR in perfused livers from mice infected with control or FGF15-expressing adenovirus and fasted as in (A) (n = 8/group). (C) Metabolic parameters in mice infected with control (Con) or FGF15-expressing adenovirus (Ad-FGF15) for 3 days and then fasted for 6 hr (n = 8/group). (D, E) Hepatic gene expression measured by QPCR in fed FGF15-knockout (KO) (D) or FGFR4-KO mice (E) or their wild-type (WT) counterparts (n = 6/group). (F, G) Plasma glucose (F) and mole percent (%) labeled glucose versus unlabeled glucose (G) following a labeled pyruvate/lactate challenge in WT and FGF15-KO mice (n = 5–6/group). (H–K) Plasma glucose and insulin concentrations in fasted-refed WT, FGF15-KO and FGFR4-KO mice at the indicated times after refeeding (n = 6/group). Data are presented as mean ± SEM (a, P< 0.05; b, P< 0.01; c, P< 0.005; d, P< 0.001). See also Fig. S2.
Figure 4
Figure 4. FGF15/19 signaling reduces CREB phosphorylation and activity
(A) Western blot analysis of total and phosphorylated FRS2α, ERK1/2, CREB, Akt, and FOXO1 in liver lysates from individual overnight fasted wild-type (WT) and FGFR4-knockout (KO) mice 30 min after treatment with vehicle or FGF19. β-Actin served as a loading control. (B–E) ChIP analysis of the cyclic AMP response elements (CRE) in the Pgc1α, G6pase, and Pepck promoters using CREB, CBP and PGC-1α antibodies as indicated and pooled liver lysates (three repeats/pool; n = 4/pool of each group). For (B), mice were administered saline or FGF19 for 1 hr and fasted during the treatment period. For (C–E), mice were injected with control or FGF15-expressing adenovirus for 3 days and killed after an overnight fast. (F) Images of luciferase activity in mice infected with a CRE-luciferase reporter (Ad-CRE-luc) or control adenovirus and subsequently treated with vehicle or FGF19 for 6 hr. Mice were fasted during the treatment period. (G) Quantified luciferase activity normalized to the number of virus particles per liver (n = 6/group). All data are presented as mean ± SEM (c, P< 0.005). See also Fig. S3.

References

    1. Ahren B, Havel PJ. Leptin increases circulating glucose, insulin and glucagon via sympathetic neural activation in fasted mice. Int J Obes Relat Metab Disord. 1999;23:660–665. - PubMed
    1. Ayala JE, Bracy DP, McGuinness OP, Wasserman DH. Considerations in the design of hyperinsulinemic-euglycemic clamps in the conscious mouse. Diabetes. 2006;55:390–397. - PubMed
    1. Ayala JE, Samuel VT, Morton GJ, Obici S, Croniger CM, Shulman GI, Wasserman DH, McGuinness OP. Standard operating procedures for describing and performing metabolic tests of glucose homeostasis in mice. Dis Model Mech. 2010;3:525–534. - PMC - PubMed
    1. Bhatnagar S, Damron HA, Hillgartner FB. Fibroblast growth factor-19, a novel factor that inhibits hepatic fatty acid synthesis. J Biol Chem. 2009;284:10023–10033. - PMC - PubMed
    1. Bittinger MA, McWhinnie E, Meltzer J, Iourgenko V, Latario B, Liu X, Chen CH, Song C, Garza D, Labow M. Activation of cAMP response element-mediated gene expression by regulated nuclear transport of TORC proteins. Curr Biol. 2004;14:2156–2161. - PubMed

Publication types

MeSH terms