. 2011 Jun 8;13(6):739-48.
doi: 10.1016/j.cmet.2011.05.002.

Desnutrin/ATGL is regulated by AMPK and is required for a brown adipose phenotype

Affiliations

Desnutrin/ATGL is regulated by AMPK and is required for a brown adipose phenotype

Maryam Ahmadian et al. Cell Metab. .

Abstract

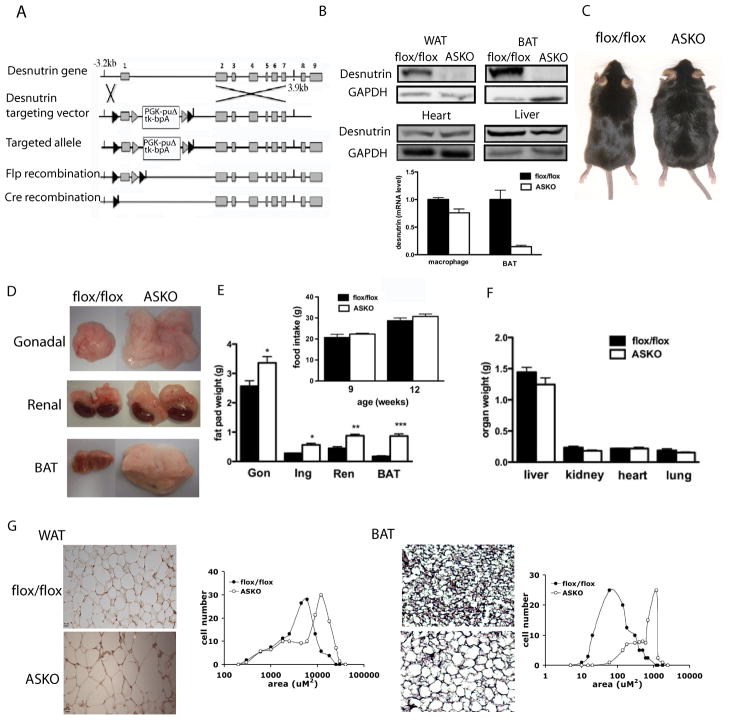
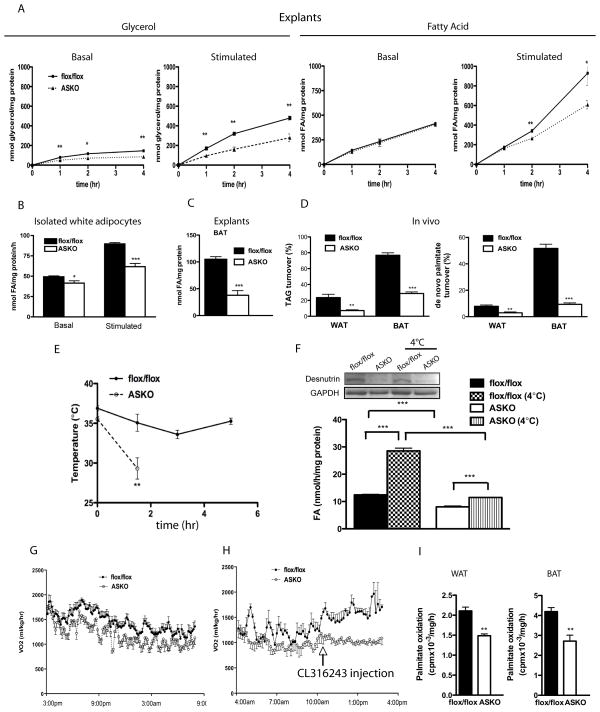
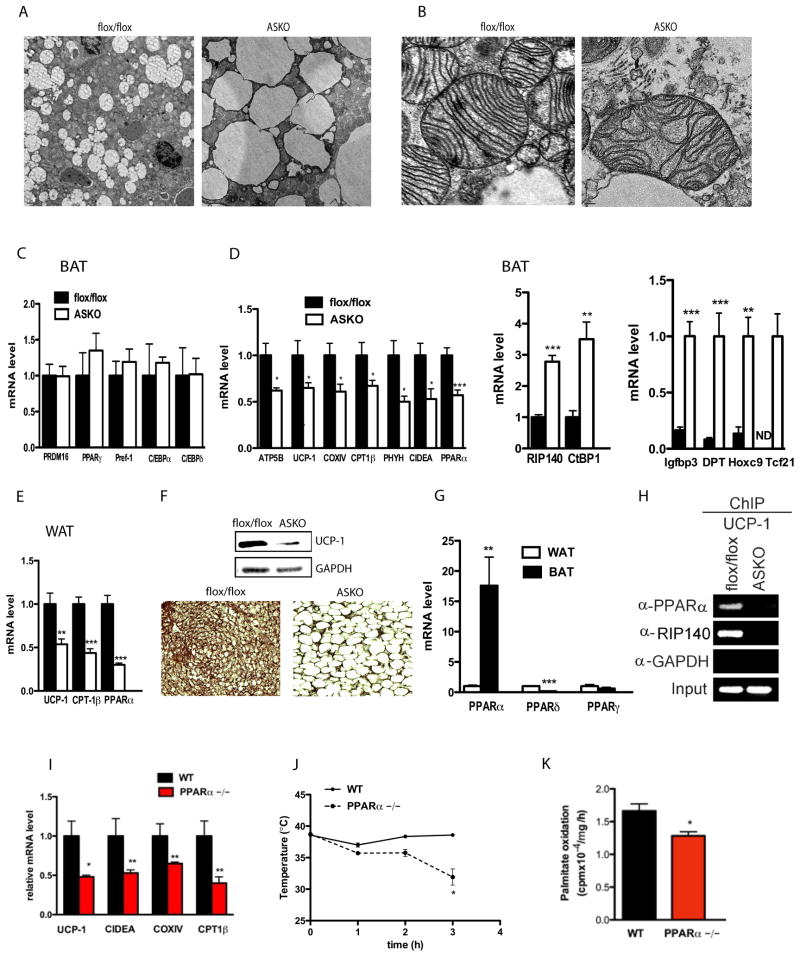
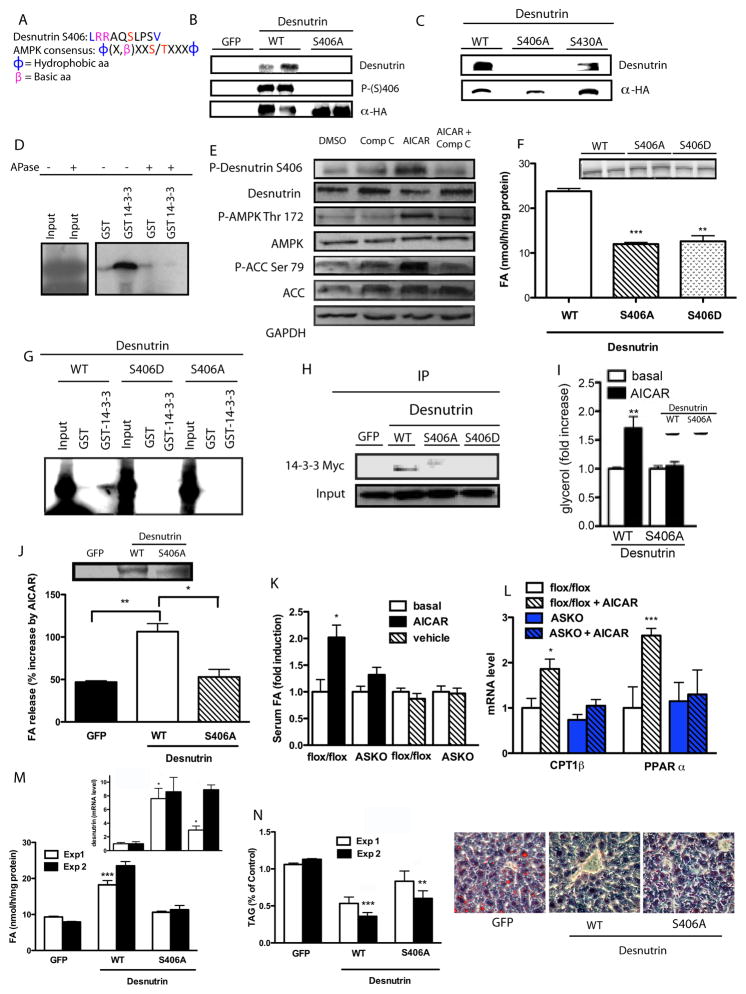
While fatty acids (FAs) released by white adipose tissue (WAT) provide energy for other organs, lipolysis is also critical in brown adipose tissue (BAT), generating FAs for oxidation and UCP-1 activation for thermogenesis. Here we show that adipose-specific ablation of desnutrin/ATGL in mice converts BAT to a WAT-like tissue. These mice exhibit severely impaired thermogenesis with increased expression of WAT-enriched genes but decreased BAT genes, including UCP-1 with lower PPARα binding to its promoter, revealing the requirement of desnutrin-catalyzed lipolysis for maintaining a BAT phenotype. We also show that desnutrin is phosphorylated by AMPK at S406, increasing TAG hydrolase activity, and provide evidence for increased lipolysis by AMPK phosphorylation of desnutrin in adipocytes and in vivo. Despite adiposity and impaired BAT function, desnutrin-ASKO mice have improved hepatic insulin sensitivity with lower DAG levels. Overall, desnutrin is phosphorylated/activated by AMPK to increase lipolysis and brings FA oxidation and UCP-1 induction for thermogenesis.


Figures

Figure 1
Figure 1. Increased adiposity in desnutrin-ASKO mice
A) Generation of adipose-specific desnutrin knockout mice. B) Western blotting of lysates (40μg) from WAT, BAT, heart and liver using a desnutrin antibody (upper) and RT-qPCR for desnutrin expression in the macrophage and BAT (lower). C) Male mice on a HFD at 16-wks of age. D) Gonadal, renal and BAT fat depots (upper, middle and lower). E) Gonadal (Gon), Inguinal (Ing), renal (Ren) and brown adipose tissue (BAT) fat pad weights and food intake (inset) (n=7). F) liver, kidney, heart and lung weights (n=7). G) Hematoxylin and eosin-stained paraffin-embedded sections of gonadal (left) and BAT (right) and quantification of cell size. Scale bar (WAT)=20μm, scale bar (BAT)=40μm. Data are expressed as means ± SEM. *P < 0.05, **P < 0.01, ***P < 0.001
Figure 2
Figure 2. Decreased lipolysis in desnutrin-ASKO mice results in impaired thermogenesis and energy expenditure
A) Glycerol (left) and FA (right) release from explants of gonadal WAT (n=6). B) FA release from isolated white adipocytes C) FA release from explants of BAT (n=3). D) Percent TAG turnover (left) and percent de novo palmitate turnover (right) in gonadal WAT and BAT. E) Body temperatures of mice exposed to the cold (4°C) in the fasted state. F) In vitro TAG hydrolase activity in BAT of mice upon cold exposure and western blotting for desnutrin (inset). G) Oxygen consumption rate (VO2) measured through indirect calorimetry. H) VO2 after intraperitoneal injection of CL316243. I) FA oxidation in white (left) and brown (right) adipocytes (n=4). Data are expressed as means ± SEM. *P < 0.05, **P < 0.01, ***P < 0.001
Figure 3
Figure 3. Desnutrin ablation converts of BAT to a WAT-like phenotype
A) Transmission electron microscopy of BAT showing the lipid droplet, scale bar=2 μm, or B) focused on mitochondria, scale bar =.2 μm. C) RT-qPCR D) BAT (n=5–10) (ND= not detected). E) RT-qPCR of WAT. (n=5–10). F) Western blotting (upper) and immunostaining (lower) for UCP-1 in BAT. G) RT-qPCR for PPARα, δ and γ in WAT and BAT of WT mice (n=3-5). H) Chromatin immunoprecipitation (ChIP) using a PPARα, RIP140 or control GAPDH antibody for binding to the UCP-1 promoter. I) RT-qPCR in BAT of PPARα null mice (n=4-5). J) Body temperature of WT and PPARα null mice exposed to 4°C in the fasted state (n=4). K) FA oxidation in white adipocytes from WT and PPARα null mice. Data are expressed as means ± SEM. *P < 0.05, **P < 0.01, ***P < 0.001
Figure 4
Figure 4. Desnutrin is phosphorylated by AMPK to increase lipolysis
A) AMPK consensus motif and murine desnutrin S406. B) Autoradiography to detect phosphorylated desnutrin after in vitro phosphorylation and western blot using a phospho-14-3-3 antibody to detect phosphorylation of S406 of desnutrin (middle) and HA antibody to detect total desnutrin protein (lower). C) Autoradiography for phosphorylated desnutrin and western blot using an HA antibody for total desnutrin. D) GST pulldown assay with in vitro translated desnutrin and GST-14-3-3 with or without alkaline phosphatase treatment (APase). E) Western blot for phospho-desnutrin at S406A, phospho-AMPK at Thr172, and phospho-ACC at Ser79 in WT desnutrin-transfected HEK 293 cells treated with compound C and AICAR. F) TAG hydrolase assay and western blot showing desnutrin overexpression (inset). G) GST pulldown of in vitro translated WT or desnutrin mutants with GST-14-3-3. H) Co-transfection followed by co-immunoprecipitation of 14-3-3-Myc with WT or desnutrin mutant. I) Glycerol release from HEK 293 cells transfected with WT or S406A desnutrin, treated with or without AICAR. J) FA release from differentiated 3T3-L1ΔCAR adipocytes infected with WT desnutrin, S406A mutant, or GFP control adenovirus after pretreatment with AICAR and western blot showing overexpression (inset). K) Serum FA levels after injection with AICAR. L) RT-qPCR for CPT1β and PPARα from gonadal WAT (n=5). M) In vitro TAG hydrolase activities, N) TAG levels (left) and cryosectioning and staining with Oil red O (right) of the livers of HFD-fed WT mice infected with WT desnutrin, S406A mutant, or GFP control adenovirus. Expression levels of WT desnutrin and S406A mutant upon adenovirus injection in liver by RT-qPCR are shown in inset. Data are expressed as means ± SEM. *P < 0.05, **P < 0.01, ***P < 0.001

References

    1. Ahmadian M, Duncan RE, Sul HS. The skinny on fat: lipolysis and fatty acid utilization in adipocytes. Trends Endocrinol Metab. 2009a;20:424–428. - PMC - PubMed
    1. Ahmadian M, Duncan RE, Varady KA, Frasson D, Hellerstein MK, Birkenfeld AL, Samuel VT, Shulman GI, Wang Y, Kang C, Sul HS. Adipose overexpression of desnutrin promotes fatty acid use and attenuates diet-induced obesity. Diabetes. 2009b;58:855–866. - PMC - PubMed
    1. Bachman ES, Dhillon H, Zhang CY, Cinti S, Bianco AC, Kobilka BK, Lowell BB. betaAR signaling required for diet-induced thermogenesis and obesity resistance. Science. 2002;297:843–845. - PubMed
    1. Barbera MJ, Schluter A, Pedraza N, Iglesias R, Villarroya F, Giralt M. Peroxisome proliferator-activated receptor alpha activates transcription of the brown fat uncoupling protein-1 gene. A link between regulation of the thermogenic and lipid oxidation pathways in the brown fat cell. J Biol Chem. 2001;276:1486–1493. - PubMed
    1. Cannon B, Nedergaard J. Brown adipose tissue: function and physiological significance. Physiol Rev. 2004;84:277–359. - PubMed

Publication types

MeSH terms