. 2011 Jul 5;108(27):11063-8.
doi: 10.1073/pnas.1106501108. Epub 2011 Jun 3.

Multiplexed RNA structure characterization with selective 2'-hydroxyl acylation analyzed by primer extension sequencing (SHAPE-Seq)

Affiliations

Multiplexed RNA structure characterization with selective 2'-hydroxyl acylation analyzed by primer extension sequencing (SHAPE-Seq)

Julius B Lucks et al. Proc Natl Acad Sci U S A. .

Abstract

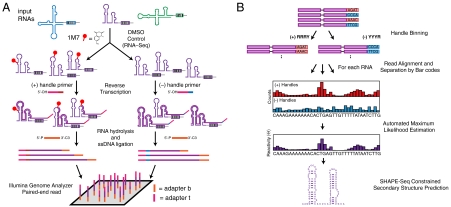
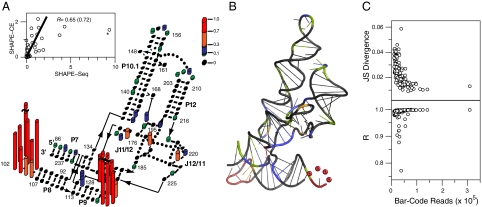
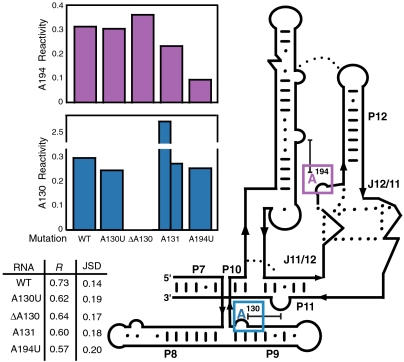
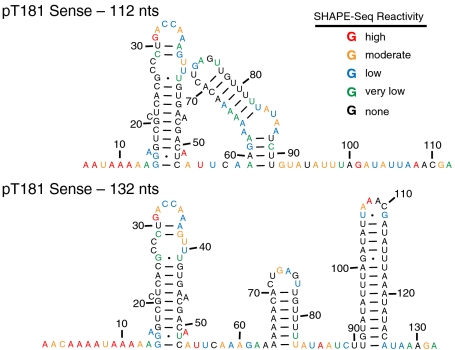
New regulatory roles continue to emerge for both natural and engineered noncoding RNAs, many of which have specific secondary and tertiary structures essential to their function. Thus there is a growing need to develop technologies that enable rapid characterization of structural features within complex RNA populations. We have developed a high-throughput technique, SHAPE-Seq, that can simultaneously measure quantitative, single nucleotide-resolution secondary and tertiary structural information for hundreds of RNA molecules of arbitrary sequence. SHAPE-Seq combines selective 2'-hydroxyl acylation analyzed by primer extension (SHAPE) chemistry with multiplexed paired-end deep sequencing of primer extension products. This generates millions of sequencing reads, which are then analyzed using a fully automated data analysis pipeline, based on a rigorous maximum likelihood model of the SHAPE-Seq experiment. We demonstrate the ability of SHAPE-Seq to accurately infer secondary and tertiary structural information, detect subtle conformational changes due to single nucleotide point mutations, and simultaneously measure the structures of a complex pool of different RNA molecules. SHAPE-Seq thus represents a powerful step toward making the study of RNA secondary and tertiary structures high throughput and accessible to a wide array of scientific pursuits, from fundamental biological investigations to engineering RNA for synthetic biological systems.


Conflict of interest statement

The authors declare no conflict of interest.

Figures

Fig. 1.
Fig. 1.
Overview of SHAPE-Seq. (A) Experimental pipeline. A DNA bar code is added to the 3′ end of template molecules, enabling SHAPE chemistry and sequencing library generation to be done on a mixture of bar-coded RNAs. (B) Bioinformatics and analysis pipeline. The automated pipeline separates reads by handle pools and bar code and maps the reads onto RNA sequences. Raw read counts at each nucleotide position in the (+) and (-) channel are fed into a ML estimation calculation to determine the reactivities at each nucleotide, Θ. Θ can be scaled and used in programs such as RNAStructure (9) to infer secondary structure from SHAPE-Seq data.
Fig. 2.
Fig. 2.
SHAPE-Seq mapping of the RNase P specificity domain. (A) Overlay of SHAPE-Seq reactivities on an RNase P structure diagram (18). Θ were converted into reactivities by the 2%/8% rule for purposes of visualization. (Inset) Correlation between SHAPE-Seq and SHAPE-CE reactivities. Solid line represents a slope of one. Nucleotide G100 (asterisk) was not included for the R value indicated in parenthesis. (B) Crystal structure of RNase P [from ref. 18)] with nucleotides color-coded by reactivity as in A. (C) The Jensen-Shannon divergence (Top) and correlation coefficient R (Bottom) calculated between each bar code and the WT RNase P Θ, plotted versus the total number of reads mapped for each bar code. The average JS divergence and R are 0.02 and 0.99, respectively.
Fig. 3.
Fig. 3.
SHAPE-Seq reactivities for position 194 (magenta bars, Top) and position 130 (blue bars, Bottom) for each RNase P variant within a seven-membered RNA library. The positions of each nucleotide are highlighted in the simplified secondary structure for RNase P on the right. Pearson’s R values and Jensen–Shannon divergences (JSD) between SHAPE-Seq and SHAPE-CE for each RNA are summarized in the table.
Fig. 4.
Fig. 4.
Secondary structure models for 112 (top) or 132 nucleotide (bottom) variants of the pT181 transcriptional attenuator. Secondary structures are the output of RNAstructure using reactivities from the SHAPE-Seq experiment as pseudo-free-energy constraints (see SI Text). Nucleotides are color-coded according to SHAPE-Seq reactivities using the color scale in Fig. 2.

Comment in

  • RNA structure probing dash seq.
    Weeks KM. Weeks KM. Proc Natl Acad Sci U S A. 2011 Jul 5;108(27):10933-4. doi: 10.1073/pnas.1107835108. Epub 2011 Jun 23. Proc Natl Acad Sci U S A. 2011. PMID: 21700884 Free PMC article. No abstract available.

References

    1. Sharp PA. The centrality of RNA. Cell. 2009;136:577–580. - PubMed
    1. Isaacs FJ, Dwyer DJ, Collins JJ. RNA synthetic biology. Nat Biotechnol. 2006;24:545–554. - PubMed
    1. Kertesz M, et al. Genome-wide measurement of RNA secondary structure in yeast. Nature. 2010;467:103–107. - PMC - PubMed
    1. Underwood JG, et al. FragSeq: Transcriptome-wide RNA structure probing using high-throughput sequencing. Nat Methods. 2010;7:995–1001. - PMC - PubMed
    1. Mauger DM, Weeks KM. Toward global RNA structure analysis. Nat Biotechnol. 2010;28:1178–1179. - PMC - PubMed

Publication types

MeSH terms