. 2011 Sep;10(9):M111.011015.
doi: 10.1074/mcp.M111.011015. Epub 2011 Jun 3.

Mass spectrometry-based proteomics using Q Exactive, a high-performance benchtop quadrupole Orbitrap mass spectrometer

Affiliations

Mass spectrometry-based proteomics using Q Exactive, a high-performance benchtop quadrupole Orbitrap mass spectrometer

Annette Michalski et al. Mol Cell Proteomics. 2011 Sep.

Abstract

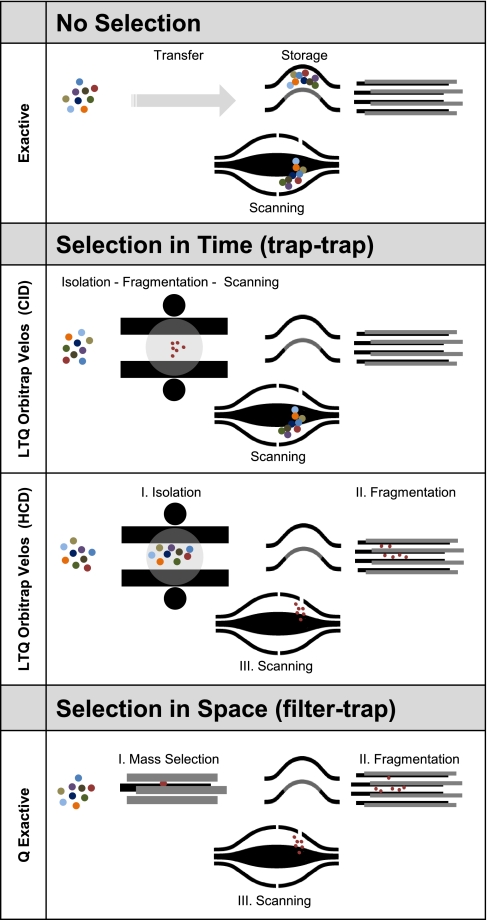
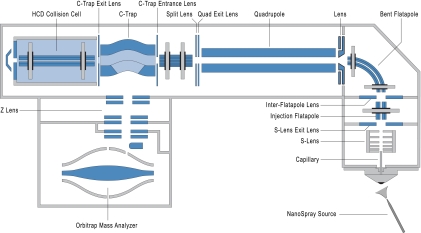
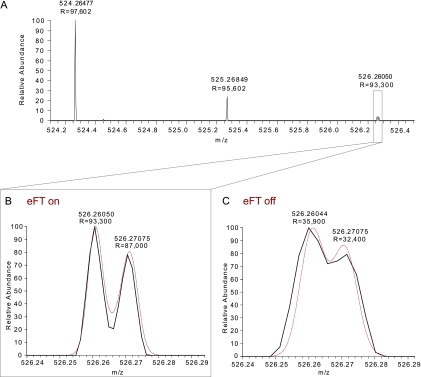
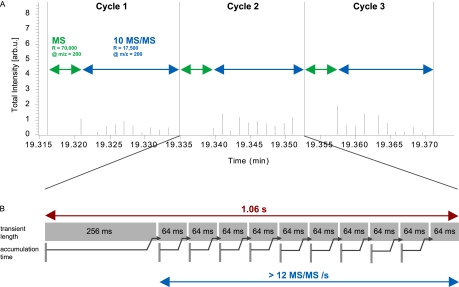
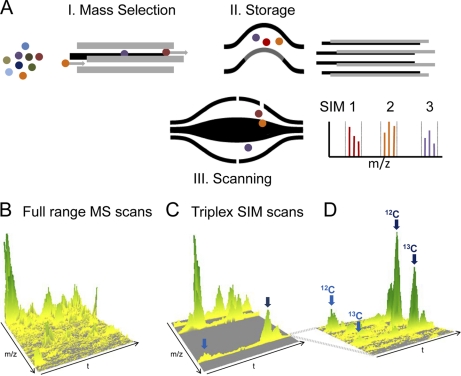
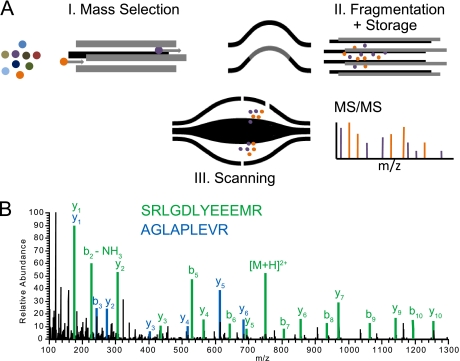
Mass spectrometry-based proteomics has greatly benefitted from enormous advances in high resolution instrumentation in recent years. In particular, the combination of a linear ion trap with the Orbitrap analyzer has proven to be a popular instrument configuration. Complementing this hybrid trap-trap instrument, as well as the standalone Orbitrap analyzer termed Exactive, we here present coupling of a quadrupole mass filter to an Orbitrap analyzer. This "Q Exactive" instrument features high ion currents because of an S-lens, and fast high-energy collision-induced dissociation peptide fragmentation because of parallel filling and detection modes. The image current from the detector is processed by an "enhanced Fourier Transformation" algorithm, doubling mass spectrometric resolution. Together with almost instantaneous isolation and fragmentation, the instrument achieves overall cycle times of 1 s for a top 10 higher energy collisional dissociation method. More than 2500 proteins can be identified in standard 90-min gradients of tryptic digests of mammalian cell lysate- a significant improvement over previous Orbitrap mass spectrometers. Furthermore, the quadrupole Orbitrap analyzer combination enables multiplexed operation at the MS and tandem MS levels. This is demonstrated in a multiplexed single ion monitoring mode, in which the quadrupole rapidly switches among different narrow mass ranges that are analyzed in a single composite MS spectrum. Similarly, the quadrupole allows fragmentation of different precursor masses in rapid succession, followed by joint analysis of the higher energy collisional dissociation fragment ions in the Orbitrap analyzer. High performance in a robust benchtop format together with the ability to perform complex multiplexed scan modes make the Q Exactive an exciting new instrument for the proteomics and general analytical communities.


Figures

Fig. 1.
Fig. 1.
Mass spectrometers incorporating an Orbitrap analyzer. The Exactive is a standalone instrument without mass selection. The total ion population is collected in the C-trap and injected into the Orbitrap analyzer (see text and Fig. 2 for details on detector components). In the LTQ Orbitrap Velos combination, ions can be selected “in time” by mass selective scans in the linear ion trap. In CID mode, the LTQ and Orbitrap operate as separate mass spectrometers. In HCD mode its function is to isolate a particular precursor, which is then fragmented in the HCD cell. In contrast, in the Q Exactive mass selection is “in space” as ions of only a specified m/z range have stable trajectories and are transferred to the storage or fragmentation devices before Orbitrap analysis.
Fig. 2.
Fig. 2.
Construction details of the Q Exactive. This instrument is based on the Exactive platform but incorporates an S-lens, a mass selective quadrupole, and an HCD collision cell directly interfaced to the C-trap. Note that the drawing is not to scale.
Fig. 3.
Fig. 3.
Resolution of the Q Exactive using eFT. A, Isotope cluster of the MRFA peptide from a mass scan with a 512 ms transient employing eFT. B, Zoom into A demonstrating resolution of the 13C2 isotope from the 34S isotope. The red curve is the simulated signal for MRFA. C, The same isotopes as in B measured with the same transient but without enabling eFT.
Fig. 4.
Fig. 4.
Cycle times for a top10 method on the Q Exactive. A, Large ticks represent the total cycle consisting of MS and MS/MS scans. Duration for the MS survey scans is indicated by the green arrows (resolution 70,000 at m/z 200 or 50,000 at m/z 400) and for the MS/MS scans by the blue arrows (resolution 17,500 at m/z 200 or 12,500 at m/z 200). The x axis indicates chromatographic elution time and the y axis the total spectral intensity. B, Total cycle time for a top10 method is about 1 s and fragmentation frequency is more than 12 Hz. The lower trace indicates parallel ion accumulation for the following scan. Note that peptide ion accumulation times for typical LC column loads are generally shorter than transient times (as indicated in this example) and that they therefore do not add to cycle times.
Fig. 5.
Fig. 5.
Proteome analysis with the Q Exactive. A, Heat map of an LC MS/MS run of a peptide mixture resulting from proteolytic digestion of a HeLa lysate. B, Zoom of a typical part of the heat map. Marks on the left hand side represent the MS survey scans of each MS and MS/MS cycle and are separated by 1 s. C, Survey spectrum showing 50,000 resolution (at m/z 400) and the isotope pattern of a triply charged precursor in green; the asterisk indicates a co-eluting precursor ion. D, MS/MS spectrum of the precursor shown in C with 12,500 resolution (at m/z 400) and zoom of a doubly charged fragment ion.
Fig. 6.
Fig. 6.
Multiplexing at the MS level. A, The quadrupole mass filter is set to transmit a specific SIM mass range. After accumulation of the desired number of ions, the quadrupole is rapidly switched to the next SIM window up to the total number of SIM windows to be monitored. The combined SIM ranges are analyzed together in one high-resolution scan as shown in cartoon form in the inset. B, Three-dimensional representation of a 4-min segment of full range MS scans from a 90 min LC run of HeLa peptides. C, Visualization of the data from triplex scans acquired directly after each full scan in the same segment. Signals of the targeted low abundant peptides are clearly visible in the three SIM scans in C but virtually absent in the full scans in B. D, Zoom of one of the SIM ranges in C show that the SIM range contains peptides of even lower abundance than the targeted one marked with the dark blue arrow.
Fig. 7.
Fig. 7.
Multiplexing at the MS/MS level. A, Different precursor ions are mass selected in the quadrupole, fragmented in turn by HCD and stored in the HCD cell. The combined fragment populations are measured together in the Orbitrap analyzer (depicted in cartoon form in the inset) B, Duplexed MS/MS spectrum.

References

    1. Aebersold R., Mann M. (2003) Mass spectrometry-based proteomics. Nature 422, 198–207 - PubMed
    1. Yates J. R., 3rd, Gilchrist A., Howell K. E., Bergeron J. J. (2005) Proteomics of organelles and large cellular structures. Nat. Rev. 6, 702–714 - PubMed
    1. Walther T. C., Mann M. (2010) Mass spectrometry-based proteomics in cell biology. J. Cell Biol. 190, 491–500 - PMC - PubMed
    1. Michalski A., Cox J., Mann M. (2011) More than 100,000 Detectable Peptide Species Elute in Single Shotgun Proteomics Runs but the Majority is Inaccessible to Data-Dependent LC-MS/MS. J. Proteome Res. 10, 1785–1793 - PubMed
    1. Köcher T., Swart R., Mechtler K. (2011) Ultra-High-Pressure RPLC Hyphenated to an LTQ-Orbitrap Velos Reveals a Linear Relation between Peak Capacity and Number of Identified Peptides. Anal. Chem. 83, 2699–2704 - PubMed

Publication types

LinkOut - more resources