. 2011 Jun 3;30(13):2634-47.
doi: 10.1038/emboj.2011.179.

Nek9 is a Plk1-activated kinase that controls early centrosome separation through Nek6/7 and Eg5

Affiliations

Nek9 is a Plk1-activated kinase that controls early centrosome separation through Nek6/7 and Eg5

M Teresa Bertran et al. EMBO J. .

Abstract

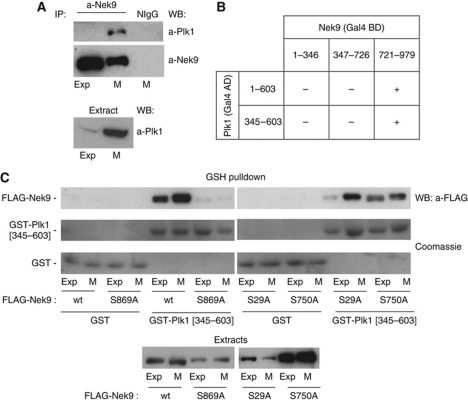
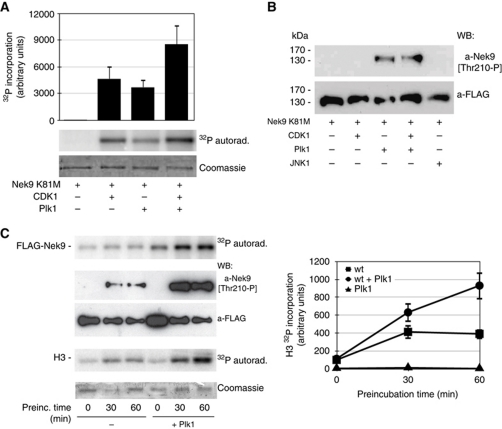
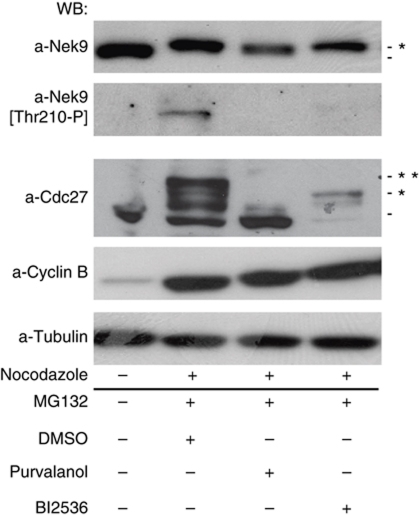
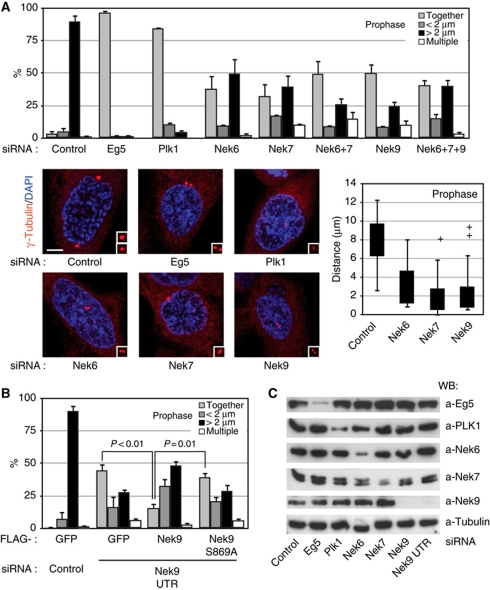
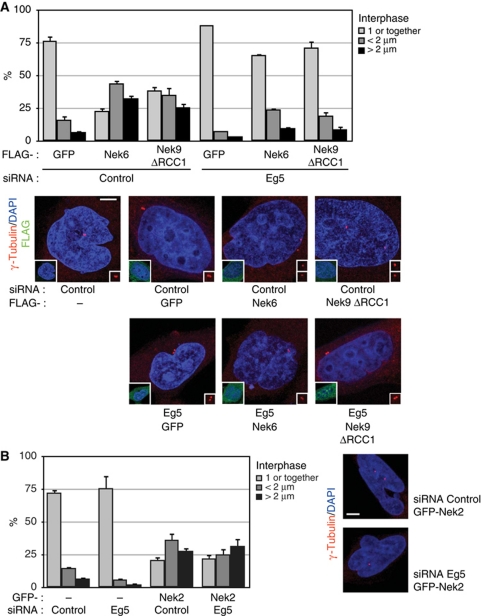
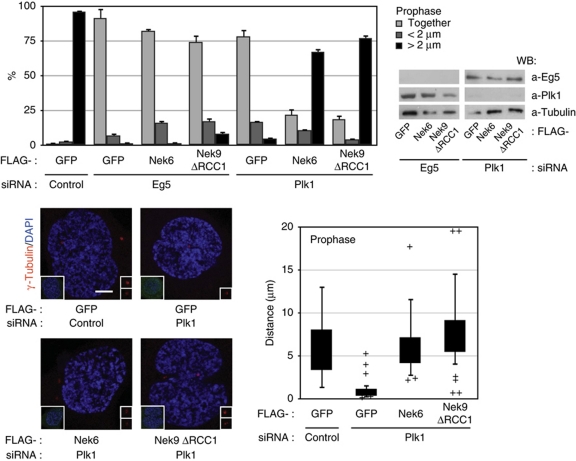
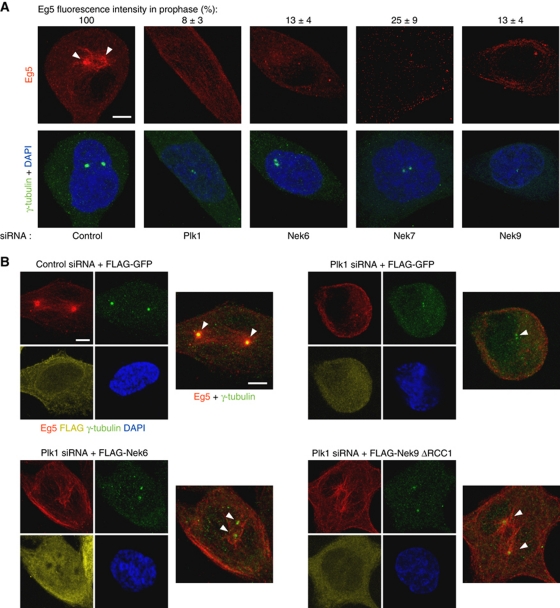
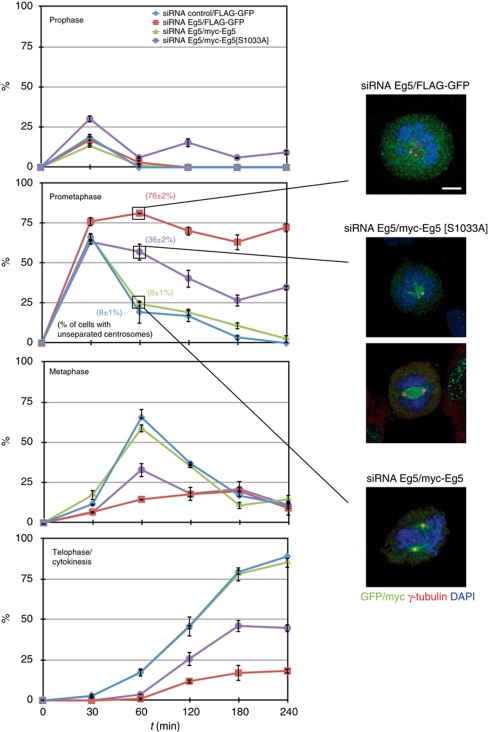
The NIMA-family kinases Nek9/Nercc1, Nek6 and Nek7 form a signalling module required for mitotic spindle assembly. Nek9, the upstream kinase, is activated during prophase at centrosomes although the details of this have remained elusive. We now identify Plk1 as Nek9 direct activator and propose a two-step activation mechanism that involves Nek9 sequential phosphorylation by CDK1 and Plk1. Furthermore, we show that Plk1 controls prophase centrosome separation through the activation of Nek9 and ultimately the phosphorylation of the mitotic kinesin Eg5 at Ser1033, a Nek6/7 site that together with the CDK1 site Thr926 we establish contributes to the accumulation of Eg5 at centrosomes and is necessary for subsequent centrosome separation and timely mitosis. Our results provide a basis to understand signalling downstream of Plk1 and shed light on the role of Eg5, Plk1 and the NIMA-family kinases in the control of centrosome separation and normal mitotic progression.


Conflict of interest statement

The authors declare that they have no conflict of interest.

Figures

Figure 1
Figure 1
Plk1 interacts with Nek9 through the PBD. (A) a-Nek9 or normal IgG (NIgG) immunoprecipitates from exponentially growing (Exp) or nocodazole-arrested mitotic (M) HeLa cell extracts were analysed by western blot (WB) using the indicated antibodies. Plk1 in the corresponding extracts is shown in the lower panel. (B) The ability of the full-length Plk1 (1–603) or Plk1 PBD (345–603) to interact with the different domains of Nek9 (kinase domain: 1–346; RCC1 domain: 347–726; C-terminal tail:721–979) was assessed using the two-hybrid assay (see Supplementary Figure S2B). Gal4 AD/BD, Gal4 activation/binding domains. (C) In vitro binding of different Nek9 forms to GST-Plk1 PBD. Extracts of exponentially growing (Exp) or nocodazole-arrested mitotic (M) HeLa cells expressing the indicated FLAG-tagged forms of Nek9 were incubated with GST or GST-PBD (GST-Plk1[345–603]) bound to GSH beads. After repeated washes, bound Nek9 was detected by WB with a-FLAG antibody, and GST-fusion proteins by Coomassie staining. FLAG-Nek9 in the corresponding extracts is shown in the lower panel.
Figure 2
Figure 2
Plk1 phosphorylates and activates Nek9. (A) Kinase-defective FLAG-Nek9[K81M] was expressed and purified from 293T cells and incubated with the indicated kinases for 30 min at 30°C in the presence of [γ-32P]ATP/Mg2+. After SDS–PAGE, Nek9 was visualized by Coomassie staining, and 32P incorporation was visualized by autoradiograph (lower and middle panels) and quantified by PhosphorImager (upper graph, mean±s.e.m. of three independent experiments). CDK1, CDK1/cyclin B. (B) FLAG-Nek9[K81M] obtained as in (A) was incubated with the indicated kinases for 60 min at 30°C in the presence of ATP/Mg2+ and analysed by western blot (WB) using the indicated antibodies. CDK1, CDK1/cyclin B. (C) FLAG-Nek9 was expressed and purified from 293T cells and incubated with or without purified Plk1 in the presence of ATP/Mg2+ for the indicated times at 25°C. After incubation, [γ-32P]ATP/Mg2+ and histone H3 were added to the reactions and further incubated for 10 min. 32P incorporation into Nek9 and H3 was visualized by autoradiograph. In parallel, total Nek9 and Nek9[Thr210-P] were visualized by WB using the indicated antibodies (left, lower panels), and H3 was visualized by Coomassie staining (left). 32P incorporation into H3 was quantified by PhosphorImager (right graph, mean±s.e.m. of three independent experiments).
Figure 3
Figure 3
CDK1 and Plk1 are necessary for Nek9 activation during mitosis. HeLa cells were arrested in mitosis with nocodazole. Mitotic cells were collected, washed and released in media containing MG132 (20 μM) plus DMSO, Purvalanol A (20 μM) or Bi2536 (100 nM) for 2 h, and cell extracts were analysed by western blot (WB) using the indicated antibodies. Untreated cells are shown in the first lane as a control. Asterisks mark protein bands with altered mobility due to phosphorylation.
Figure 4
Figure 4
Plk1, Nek9, Nek6, Nek7 and Eg5 are necessary for normal centrosome separation in prophase. (A) HeLa cells were transfected with the indicated siRNAs, and after 24 (Eg5, Plk1) or 48 (control, Nek6, Nek7, Nek9) hours, fixed and stained with antibodies against γ-tubulin (red) and DAPI (blue). Cells showing condensed chromosomes and intact nuclei (assessed by the shape of the DNA and a γ-tubulin exclusion from the nucleus) were scored as in prophase (these cells were 100% positive for histone H3[Ser10] phosphorylation, thus confirming the cell-cycle phase assignation, data not shown). The percentage of prophase cells showing two unseparated centrosomes (together), two centrosomes separated <2 μm (<2 μm), fully separated centrosomes (>2 μm) or more than two centrosomes (multiple centrosomes) is shown in the upper graphic (mean±s.e.m. of three independent experiments; ∼50 cells counted in each experiment). Additionally, the distribution of distances from the centre of the duplicated centrosomes in each case is shown as a box plot (boxes show the first and third quartiles, whiskers mark minimum and maximum values unless these exceed 1.5 × interquartile range and crosses correspond to outliers; 20 cells counted for each experimental condition). Representative examples of the observed phenotypes are shown (bar, 5 μm). In each case, insets show magnified centrosomes. (B) HeLa cells were cotransfected with either control or Nek9 3′ UTR siRNAs plus expression plasmids for the indicated FLAG-tagged proteins, and 48 h latter processed and FLAG-positive cells scored as in (A) (mean±s.e.m. of three independent experiments; ∼40 cells counted in each experiment; statistical significance was determined using the standard Student's t-test). Levels of endogenous and recombinant Nek9 as determined by western blot are shown in Supplementary Figure S4C. (C) Efficiency of the different RNAi treatments used in (A) or (B) as determined by western blot of total cell extracts.
Figure 5
Figure 5
Active Nek9 and Nek6 induce centrosome separation in an Eg5-dependent manner. (A) HeLa cells were transfected with either control or Eg5 siRNAs, after 16 h retransfected with expression plasmids for the indicated FLAG-tagged proteins (Nek9ΔRCC1, Nek9[Δ346–732]) and 24 h latter fixed and stained with anti-γ-tubulin (red) and anti-FLAG (green) antibodies plus DAPI (blue). The percentage of FLAG-positive cells showing 1 or 2 unseparated centrosomes (1 or together), two centrosomes separated <2 μm (<2 μm) or fully separated centrosomes (>2 μm) is shown in the upper graphic (mean±s.e.m. of three independent experiments; ∼50 cells counted in each experiment). Representative examples of the observed phenotypes (anti-γ-tubulin plus DAPI) are shown below (bar, 5 μm). Insets show the same field stained with anti-FLAG plus DAPI. The effect of the different treatments on the levels of Eg5 can be seen in Figure 6, upper right panel. (B) As in (A), cells transfected with either control or Eg5 siRNAs and expression plasmids for GFP or GFP-Nek2 (mean±s.e.m. of three independent experiments; ∼50 cells counted in each experiment).
Figure 6
Figure 6
Active Nek9 and Nek6 can rescue Plk1 but not Eg5 downregulation in prophase centrosome separation. HeLa cells were transfected with control, Eg5 or Plk1 siRNAs plus the indicated plasmids and processed as in Figure 5 (Nek9ΔRCC1, Nek9[Δ346–732]). The percentage of FLAG-positive prophase cells showing two unseparated centrosomes (together), two centrosomes separated <2 μm (<2 μm) or fully separated centrosomes (>2 μm) is shown in the upper graphic (mean±s.e.m. of three independent experiments; ∼40 cells counted in each experiment). The effect of the different transfections on the levels of Plk1 and Eg5 is shown (right). Lower panels show representative examples of the observed phenotypes (anti-γ-tubulin plus DAPI staining, bar, 5 μm; insets show the same field stained with anti-FLAG plus DAPI) and a box plot of the distribution of distances from the centre of the duplicated centrosomes in FLAG-positive cells (as in Figure 4; 30 cells counted for each experimental condition).
Figure 7
Figure 7
Plk1 controls Eg5 phosphorylation at the Nek6 site Ser1033. Both Ser1033 and the CDK1 site Thr926 phosphorylation are necessary for prophase centrosome separation and Eg5 recruitment. (A) HeLa cells were arrested in mitosis by either nocodazole (ND) treatment or RNAi against Plk1 or Eg5 (24 h transfection), collected after mitotic shake off and cell extracts were analysed by western blot (WB) using the indicated antibodies. Mitotic arrest was confirmed by FACS (not shown) and the phosphorylatin state of Cdc27. Untreated cells (Exp) are shown in the first lane as a control. Asterisks mark protein bands with altered mobility due to phosphorylation. (B) HeLa cells were transfected with either control or Eg5 siRNAs, after 16 h retransfected with expression plasmids for the indicated Myc-tagged proteins (cDNAs rendered resistant to the siRNA by several silent point mutations), fixed and stained with antibodies against Myc, γ-tubulin and DAPI. The percentage of Myc-positive prophase cells showing two unseparated centrosomes (together), two centrosomes separated <2 μm (<2 μm) or fully separated centrosomes (>2 μm) is shown in the upper graphic (mean±s.e.m. of three independent experiments; ∼40 cells counted in each experiment). Levels of endogenous and recombinant Eg5 as determined by WB are shown in Supplementary Figure S6C. (C) Cells transfected and processed as in (B). Representative examples of the observed phenotypes (Myc–Eg5, green) are shown below (bar, 5 μm). Insets show the same field stained with γ-tubulin (red) plus DAPI (blue). Centrosomal accumulation of Eg5 is noted with arrows.
Figure 8
Figure 8
Plk1, Nek9, Nek6, Nek7 are necessary for centrosome recruitment of Eg5 during prophase. Active Nek9 and Nek6 can rescue Plk1 downregulation in prophase Eg5 recruitment. (A) HeLa cells were transfected with the indicated siRNAs, and after 24 (Plk1) or 48 (control, Nek6, Nek7, Nek9) hours, fixed and stained with antibodies against Eg5, γ-tubulin and DAPI. Representative examples of Eg5 (red) distribution in prophase cells are shown. Insets show the same field stained with γ-tubulin (green) and DAPI (blue). Centrosomal accumulation of Eg5 is noted with arrowheads. Bar, 5 μm. The efficiency of the different RNAi treatments can be seen in Figure 4C. Centrosomal Eg5 fluorescence intensity was quantified with ImageJ software on images acquired under constant exposure, using a circular area of 2 μm diameter surrounding a single centrosome (identified by γ-tubulin staining; an adjacent area of the same dimensions within each cell was quantified and subtracted as background). Results are expressed as a percentage of the intensities measured in control cells±s.e.m. (three independent experiments; >20 centrosomes counted in each experiment). (B) HeLa cells were cotransfected with either control or Plk1 siRNAs and expression plasmids for the indicated proteins and after 24 h fixed and stained with antibodies against Eg5, γ-tubulin and DAPI (Nek9ΔRCC1, Nek9[Δ346–732]). After incubation with labelled secondary antibodies, FLAG was detected with Fab-prelabelled anti-FLAG (see Materials and methods). Representative examples of Eg5 distribution in prophase cells are shown. Images show the same field stained with Eg5 (red), γ-tubulin (green), FLAG (yellow) and DAPI (blue), and a composite of Eg5 (red) plus γ-tubulin (green). Centrosomal accumulation of Eg5 is noted with arrowheads. Bar, 5 μm.
Figure 9
Figure 9
Effects of Eg5[Ser1033Ala] on cell-cycle progression. HeLa cells were transfected with either control or Eg5 siRNAs, after 16 h retransfected with expression plasmids for the indicated Myc-tagged proteins (cDNAs rendered resistant to the siRNA by several silent point mutations). After 24 h, cells were incubated 20 h with 9 μM RO-3306. Synchronization in G2 was confirmed by FACS. Cells were released in fresh media after repeated washes, and at the indicated times fixed and stained with antibodies against myc or GFP, γ-tubulin and DAPI. Mitotic myc- or GFP-positive cells were categorized according to mitotic phase (mean±s.e.m. of three independent experiments; ∼40 mitotic cells counted in each experiment). Representative examples of prometaphase cells as well as the percentage of cells in this phase of the cell cycle with unseparated centrosomes (distance <2 μm) at 60 min postrelease is shown, see Supplementary Figure S9 (mean±s.e.m. of three independent experiments; ∼30 cells counted in each experiment; bar, 5 μm).

References

    1. Archambault V, Glover DM (2009) Polo-like kinases: conservation and divergence in their functions and regulation. Nat Rev Mol Cell Biol 10: 265–275 - PubMed
    1. Belham C, Roig J, Caldwell JA, Aoyama Y, Kemp BE, Comb M, Avruch J (2003) A mitotic cascade of NIMA family kinases. Nercc1/Nek9 activates the Nek6 and Nek7 kinases. J Biol Chem 278: 34897–34909 - PubMed
    1. Blangy A, Arnaud L, Nigg EA (1997) Phosphorylation by p34cdc2 protein kinase regulates binding of the kinesin-related motor HsEg5 to the dynactin subunit p150. J Biol Chem 272: 19418–19424 - PubMed
    1. Blangy A, Lane HA, d’Hérin P, Harper M, Kress M, Nigg EA (1995) Phosphorylation by p34cdc2 regulates spindle association of human Eg5, a kinesin-related motor essential for bipolar spindle formation in vivo. Cell 83: 1159–1169 - PubMed
    1. Elia AE, Cantley LC, Yaffe MB (2003) Proteomic screen finds pSer/pThr-binding domain localizing Plk1 to mitotic substrates. Science 299: 1228–1231 - PubMed

Publication types

MeSH terms