. 2011 Jun 5;8(7):592-8.
doi: 10.1038/nmeth.1625.

High-throughput behavioral analysis in C. elegans

Affiliations

High-throughput behavioral analysis in C. elegans

Nicholas A Swierczek et al. Nat Methods. .

Abstract

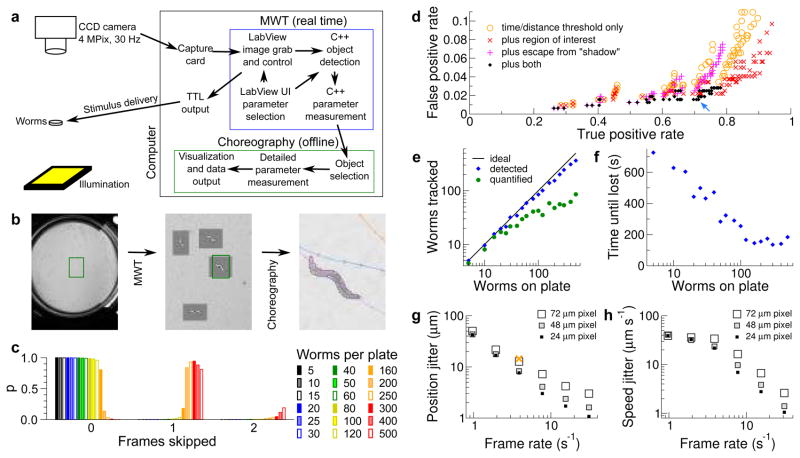
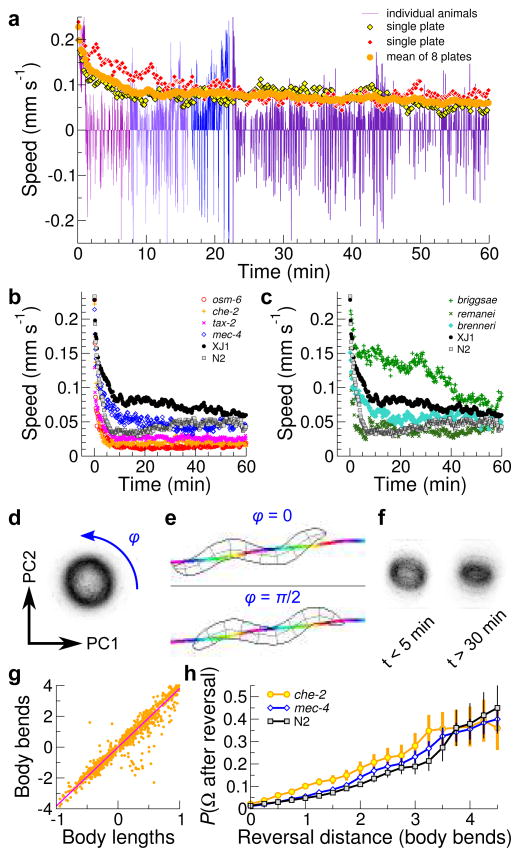
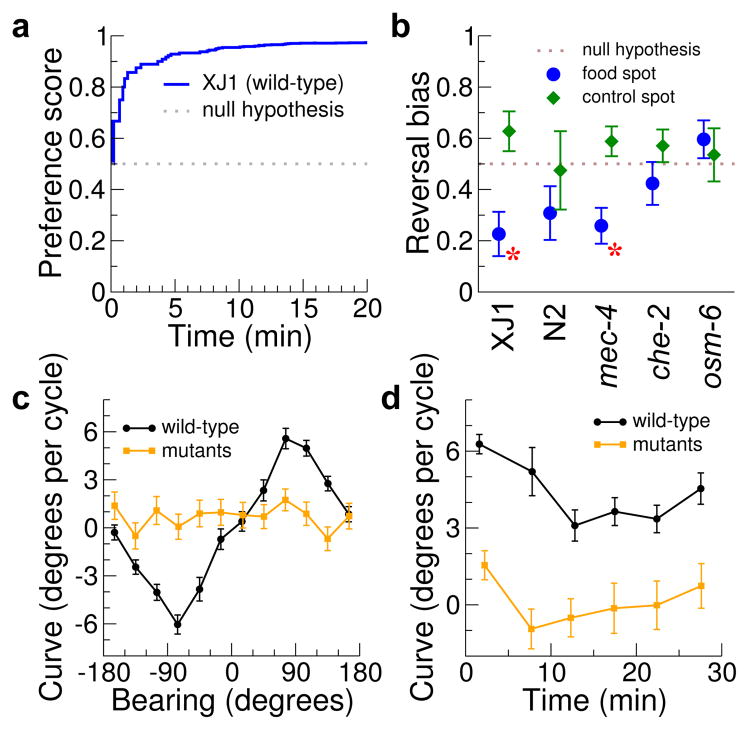
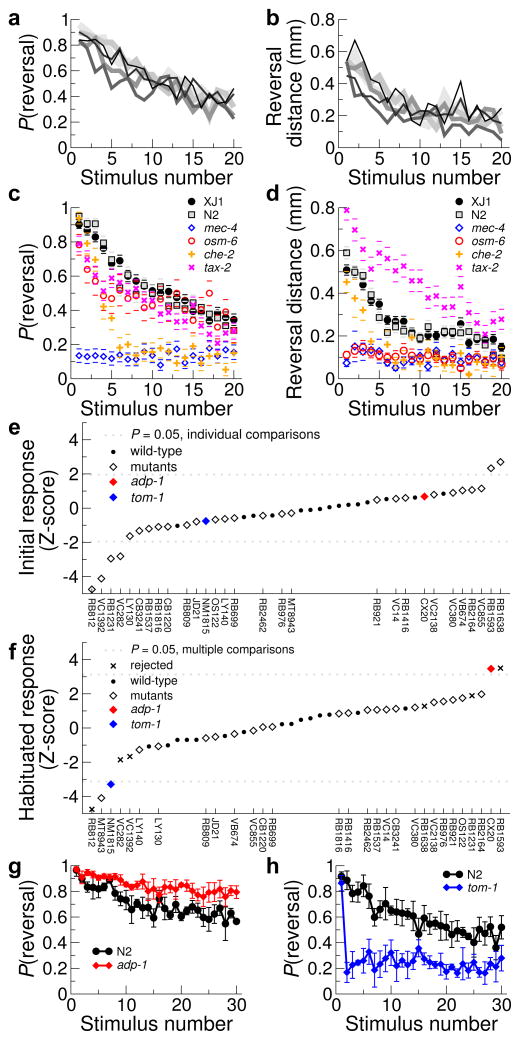
We designed a real-time computer vision system, the Multi-Worm Tracker (MWT), which can simultaneously quantify the behavior of dozens of Caenorhabditis elegans on a Petri plate at video rates. We examined three traditional behavioral paradigms using this system: spontaneous movement on food, where the behavior changes over tens of minutes; chemotaxis, where turning events must be detected accurately to determine strategy; and habituation of response to tap, where the response is stochastic and changes over time. In each case, manual analysis or automated single-worm tracking would be tedious and time-consuming, but the MWT system allowed rapid quantification of behavior with minimal human effort. Thus, this system will enable large-scale forward and reverse genetic screens for complex behaviors.


Conflict of interest statement

Competing Financial Interests

The authors declare no competing financial interests.

Figures

Figure 1
Figure 1
Accuracy and performance of the Multi-Worm Tracker. (a) The major components of the Multi-Worm Tracker system. (b) Examples of full-field images, the regions selected for analysis by the MWT, and post-capture visualization in Choreography. (c) The plot shows the probability that a given number of frames will be dropped for each frame processed, with increasing number of worms. (d) Accuracy of detection and selection of worms for analysis. A false positive is either an object which is not a worm, or a worm scored by hand as partially obscured. Each dot corresponds to a different choice for time and distance threshold. Orange circle: no additional criteria. Red X: animals must be in a region of interest away from the edges of the plate. Magenta +: animals must move one body length before being quantified to avoid image processing artifacts. Black diamond: both additional criteria. Blue arrow: our typical choice of parameters. (e) Effect of crowding on fraction of animals detected (blue diamonds) or selected for analysis (green dots, using parameters chosen in d). (f) Effect of crowding on duration one worm can be followed (identity is lost upon collision). (g, h) Effect of pixel size and frame rate on estimate of animal position (g; the orange X indicates typical parameters for a non-real-time tracker, Parallel Worm Tracker) and of animal speed (h; movement averaged over 0.5 s).
Figure 2
Figure 2
Worm movement on food. (a) The plot shows worm speeds for selected individual plates (red or yellow diamonds) or as a mean for all plates (orange dots) over time (n ≈ 30 tracked animals per plate). (b, c) The plots show the return to steady-state speeds in the indicated strains after being placed on the tracker (b; mean of four plates, n ≥ 15 worms per plate) and in different Caenorhabditis species (c; mean of four plates, n ≥ 20 worms per plate). (d) Intensity map of first two principal components of worm shape computed from the reference data set; darker colors indicate more observations. The ring shape of the map corresponds to the worm’s sinusoidal movement cycle; the blue arrow indicates forward movement or an increase in phase. (e) Example of phase progression. Snapshots correspond to sine-like and cosine-like postures; rainbow line is the animal’s path colored by phase. (f) Intensity map as in d at the indicated time points after worms are placed on the tracker. n ≈ 20 tracked worms on one plate, strain XJ1. (g) Worm centroid movement (in body lengths) is plotted against estimated number of body bends (phase advance). Individual movements (orange dots) and best linear fit (magenta line) are shown. (h) The probability of omega turn initiation is plotted against reversal distance(number of body bends) for the indicated strains. n ≈ 400 omega turns per strain.
Figure 3
Figure 3
Analysis of chemotaxis. (a) Chemotaxis effectiveness of wild type worms. Preference score is the Bayesian estimate of the probability that an animal will travel into the food spot instead of the control spot. n = 8 plates, ~8 worms tracked per plate. (b) Pirouette frequencyof the indicated strains near food. Reversal bias is fT/(fT+fA), where f is the frequency of reversals when moving towards (fT) or away (fA) from food (blue) or control spot (green). Error bars, s.e.m. from monte carlo simulation. Red asterisks: P < 0.05 that reversals are equally common when traveling towards vs. away from food (χ2 test). (c) Weathervane chemotaxis to NaCl in the absence of food. The mean curve of the animal’s path is plotted against its bearing relative to the gradient (see Online Methods for more detail); signs are chosen so that positive curve at positive bearing is a turn up the gradient. Black is wild-type (N2, 30 plates of ten worms each). Orange shows chemotaxis mutants (che-2, osm-6, and tax-2; five plates of ten worms of each, mutant data are pooled since we found no significant differences between the strains). Error bars, s.e.m.. (d) Decrease in strength of weathervane chemotaxis with time. Positive curve is up the gradient and results are averaged over quadrants around ±90° bearing. P < 0.001 (t-test) that the first 10 minutes and the next 20 are the same.
Figure 4
Figure 4
Analysis of tap habituation. (a, b) Probability of reversing (a, Bayesian estimate) or reversal distance (b) after a tap are plotted against the number of tap stimuli. Six plates of wild-type (XJ1) animals are plotted in different shades of gray. n ≈ 30 animals per plate. (c, d) Reversal probability (c) and distance (d) for mechanosensory and chemosensory mutants are plotted against the number of tap stimuli. n = 3 plates for mutants and N2, 6 plates for XJ1, ≥ 10 animals per plate; error bars are s.e.m. (e) Probability of response to first tap of various mutants (diamonds) and wild-type controls (circles); Z-score is normalized by wild-type distribution. (f) Habituated response probabilities (at stimuli 28–30). X denotes mutants with abnormal initial response. (g, h) Probability of reversal after tap is plotted for the loss-of-habituation mutant adp-1 (g) and the hyper-habituation mutant tom-1 (h).

References

    1. Baek JH, Cosman P, Feng Z, Silver J, Schafer WR. Using machine vision to analyze and classify Caenorhabditis elegans behavioral phenotypes quantitatively. J Neurosci Methods. 2002;118:9–21. - PubMed
    1. Feng Z, Cronin CJ, Wittig JH, Sternberg PW, Schafer WR. An imaging system for standardized quantitative analysis of C. elegansbehavior. BMC Bioinformatics. 2004;5:115. - PMC - PubMed
    1. Cronin CJ, Feng Z, Schafer WR. Automated imaging of C. elegans behavior. Methods Mol Biol. 2006;351:241–251. - PubMed
    1. Ramot D, Johnson BE, Berry TL, Carnell L, Goodman MB. The Parallel Worm Tracker: a platform for measuring average speed and drug-induced paralysis in nematodes. PLoS ONE. 2008;3:e2208. - PMC - PubMed
    1. Tsechpenakis G, Bianchi L, Metaxas D, Driscoll M. A novel computational approach for simultaneous tracking and feature extraction of C. elegans populations in fluid environments. IEEE Trans Biomed Eng. 2008;55:1539–1549. - PubMed

Publication types