. 2011 Jun 5;14(7):933-9.
doi: 10.1038/nn.2856.

Neuronal basis of sequential foraging decisions in a patchy environment

Affiliations

Neuronal basis of sequential foraging decisions in a patchy environment

Benjamin Y Hayden et al. Nat Neurosci. .

Abstract

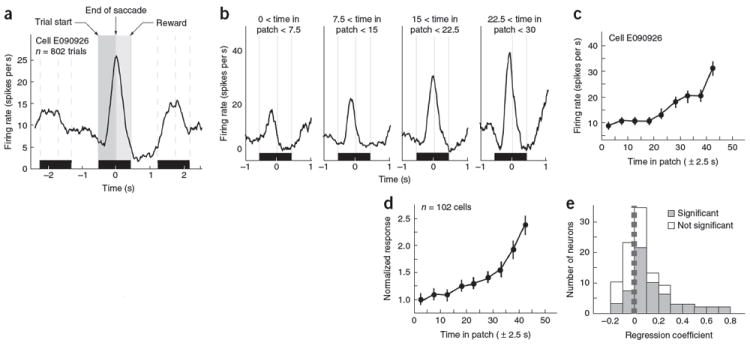
Deciding when to leave a depleting resource to exploit another is a fundamental problem for all decision makers. The neuronal mechanisms mediating patch-leaving decisions remain unknown. We found that neurons in primate (Macaca mulatta) dorsal anterior cingulate cortex, an area that is linked to reward monitoring and executive control, encode a decision variable signaling the relative value of leaving a depleting resource for a new one. Neurons fired during each sequential decision to stay in a patch and, for each travel time, these responses reached a fixed threshold for patch-leaving. Longer travel times reduced the gain of neural responses for choosing to stay in a patch and increased the firing rate threshold mandating patch-leaving. These modulations more closely matched behavioral decisions than any single task variable. These findings portend an understanding of the neural basis of foraging decisions and endorse the unification of theoretical and experimental work in ecology and neuroscience.


Conflict of interest statement

COMPETING FINANCIAL INTERESTS

The authors declare no competing financial interests.

Figures

Figure 1
Figure 1
Patch-leaving task. (a) Task design. After fixation, two eccentric targets, a large gray and a small blue rectangle, appear. Monkey chooses one of two targets by shifting gaze to it. Choice of blue rectangle (stay in patch) yields a short delay (0.4 s, handling time) and reward whose value diminishes by 19 μl per trial. Choice of gray rectangle (leave patch) yields no reward and a long delay (travel time) whose duration is indicated by the height of the bar, and resets the value of the blue rectangle at 306 μl. Travel time varies randomly from patch to patch and ranges from 0.5 to 10.5 s. (b) Plot of the cumulative reward available in this task as a function of time in patch, given the search times associated with animals’ performance in the task (black line). Data are generated on the basis of average times associated with performance. (c) Plot of reward intake rate derived from a range of patch residence times (x axis: range of residence times). Data are shown for each of ten travel times (1-s intervals from 0.5 to 10.5 s). Rate-maximizing time in patch (the curves’ maxima, shown by the black line) increases with increasing travel time. Data are generated based on average times associated with actual animal performance.
Figure 2
Figure 2
Monkeys obey the marginal value theorem in a virtual patchy foraging task. (a) Monkeys remain in the patch longer as travel time rises, as predicted by the marginal value theorem (MVT). Each dot indicates a single patch-leaving decision (n = 2,834 patch-leaving events). The time at which the monkey chose to leave the patch (y axis) was defined relative to the beginning of foraging in that patch. Travel time was kept constant in a patch (x axis). Data from both monkeys is shown. Behavior (average is traced by the blue line) closely followed the rate-maximizing leaving time (red line), albeit delayed by 0–2 s. (b) Performance of two monkeys on handling time variant of patch-leaving task. In this control experiment, travel time was held constant (5 s) and handling time was randomly reset between each patch to have one of ten values. Patch residence time fell as handling time rose, consistent with the MVT. Observed times are shown with black dots; averages are shown with solid blue line. Best-fit line (dashed blue line) is nearly identical to rate-maximizing (red line). Average patch residence time on the interleaved standard travel time version of the task was consistent with this curve as well (red dots).
Figure 3
Figure 3
Firing rates of dACC neurons integrate patch residence time and travel time in computations occurring over multiple actions. (a) Average reward-aligned peri-stimulus time histograms (PSTHs) for example cell. Neuronal responses were briefly enhanced around the time of saccades and then fell to a baseline level between trials. Time zero indicates end of saccade, indicating choice. Dark gray box, pre-saccadic epoch. Light gray box, post-saccadic epoch. Black rectangle indicates the average duration of the trial. (b) The firing rate during the peri-saccadic period rose with time in patch. Each panel indicates responses selected from one range of patch residence times. (c,d) Average responses of example neuron (c) and population of neurons (d) occurring in a series of 5-s analysis epochs (gray box in a). Firing rates increased as time in patch increased. Error bars represent s.e.m. (e) Histogram of regression coefficients relating firing rate in pre-saccadic epoch to time in patch for each neuron in the population (n = 102). Significant effects are indicated with gray boxes (P < 0.05).
Figure 4
Figure 4
Firing rates of dACC neurons rise to a threshold associated with patch abandonment. (a) Plot of patch-leaving times, separated by whether they were earlier or later than the average leaving time. We divided patch-leaving decisions into four categories: earliest (black), early (red), late (cyan) and latest (magenta). These variables are independent of travel time and time in patch, meaning that, for example, earliest trials are equally likely to occur at any travel time (x axis) and any time in patch (y axis). (b) PSTH for an example neuron separated by earliness level. dACC neurons responded sooner and more strongly on earlier trials than on later trials. Black rectangle indicates the average duration of the trial. (c,d) Average firing rates of example neuron (c) and population (d) separated by earliness level. Firing rates rose faster for earlier patches but asymptoted at the same level. Error bars represent s.e.m. (e) Plot of average firing rate of population of neurons, aligned to final trial in patch (x = 0 on graph) and showing the final three trials before switch (x = 1, 2 and 3). Firing rates rose to the same level on final trial, as well as preceding trials. Error bars represent s.e.m.
Figure 5
Figure 5
Travel time governs both neuronal response gain and threshold. (a) Schematic of three possible mechanisms by which exogenous factors may govern a rise-to-threshold process. Shorter travel times can hasten patch-leaving (leftward movement on x axis) by increasing the rate of rise, reducing the threshold or elevating the baseline. (b,c) Evidence that travel times change rate of rise. Example neuron (b) and population (c) average regression slopes (beta weights) for firing rate as a function of time in patch. Beta weights fell as travel times rose, indicating that shorter travel time increases neuronal response gain. Error bars represent s.e.m. (d,e) Evidence that travel time influences firing threshold for patch abandonment. Firing rate on patch-leaving trial was taken as a proxy for threshold level. Example neuron (d) and population (e) show increasing firing rates on patch-leaving trial as travel time increases (black dots). Firing rate on penultimate trial also rose with travel time, consistent with a multi-trial integration process. Error bars represent s.e.m.

References

    1. Prins HHT. Ecology and Behavior of the African Buffalo: Social Inequality and Decision Making. Chapman and Hall; London: 1996.
    1. Charnov EL. Optimal foraging, the marginal value theorem. Theor Popul Biol. 1976;9:129–136. - PubMed
    1. Stephens DW, Krebs JR. Foraging Theory. Princeton University Press; Princeton, NJ: 1986.
    1. Bendesky A, Tsunozaki M, Rockman MV, Kruglyak L, Bargmann CI. Catecholamine receptor polymorphisms affect decision-making in C. elegans. Nature. 2011;472:313–318. - PMC - PubMed
    1. Thompson D, Fedak MA. How long should a dive last? A simple model of foraging decisions by breath-hold divers in a patchy environment. Anim Behav. 2001;61:287–296.

Publication types

MeSH terms

LinkOut - more resources