. 2011 Jun 5;14(7):911-8.
doi: 10.1038/nn.2847.

High-fat feeding promotes obesity via insulin receptor/PI3K-dependent inhibition of SF-1 VMH neurons

Affiliations

High-fat feeding promotes obesity via insulin receptor/PI3K-dependent inhibition of SF-1 VMH neurons

Tim Klöckener et al. Nat Neurosci. .

Abstract

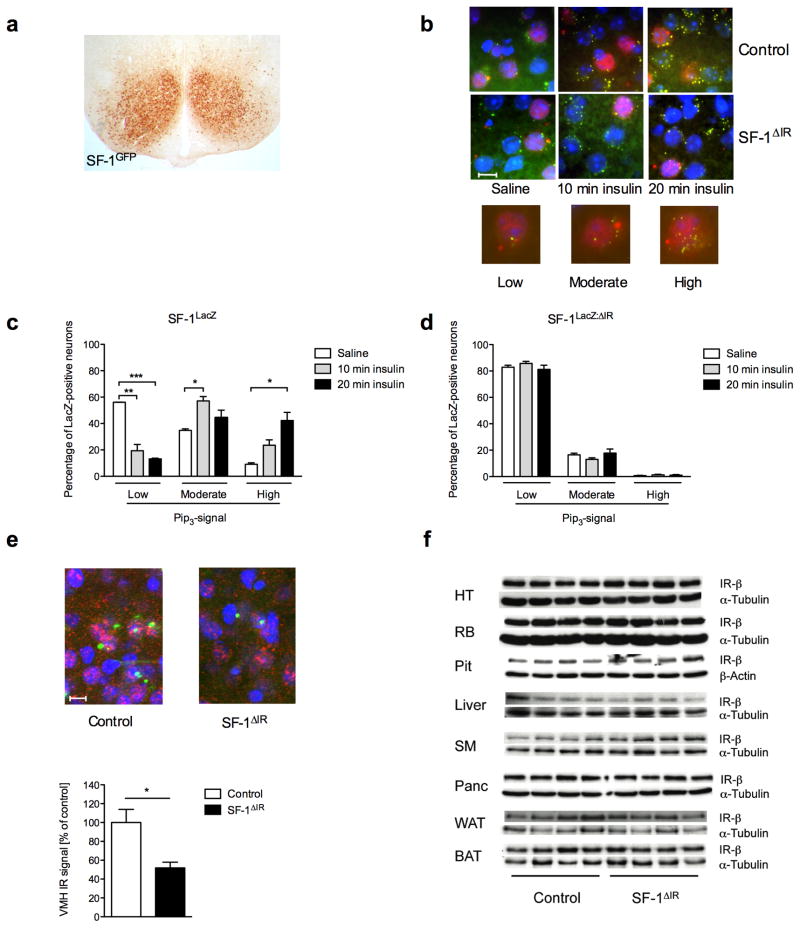
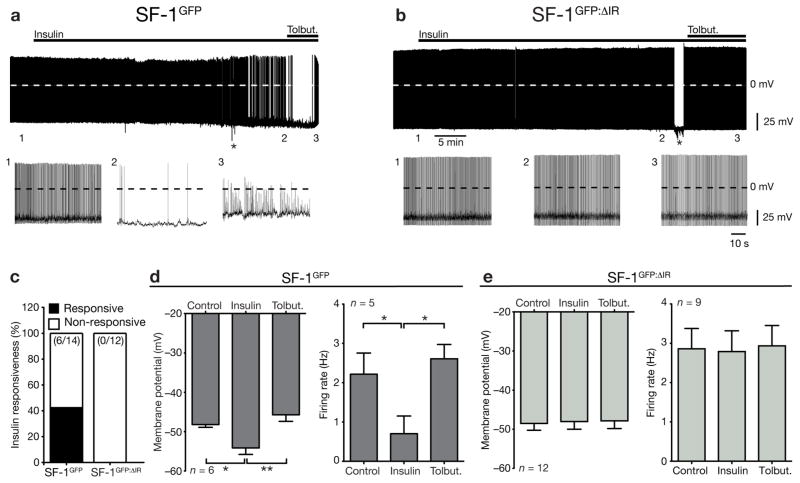
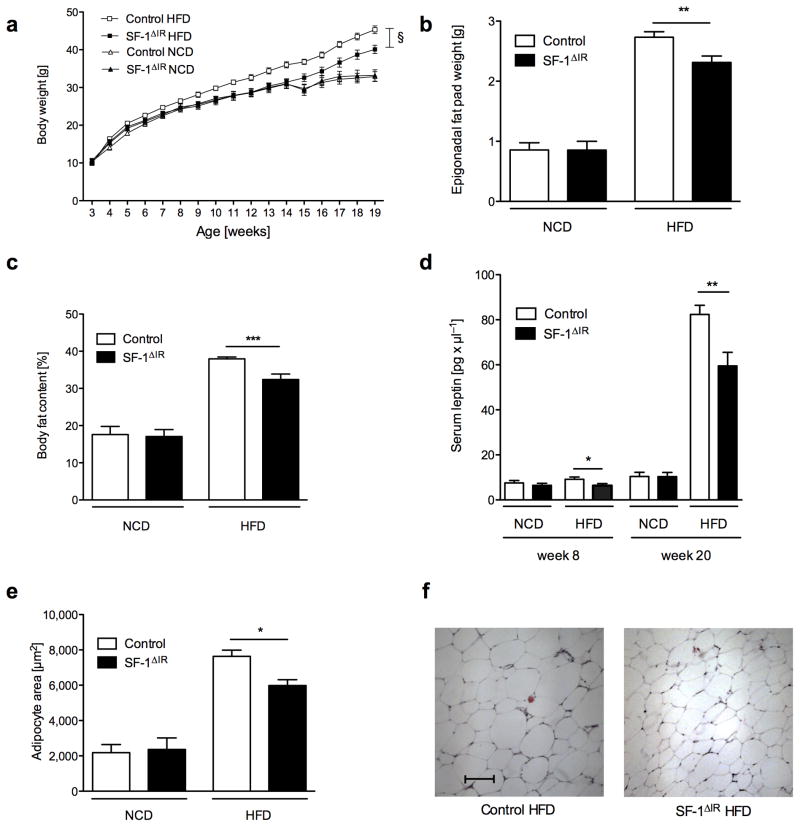
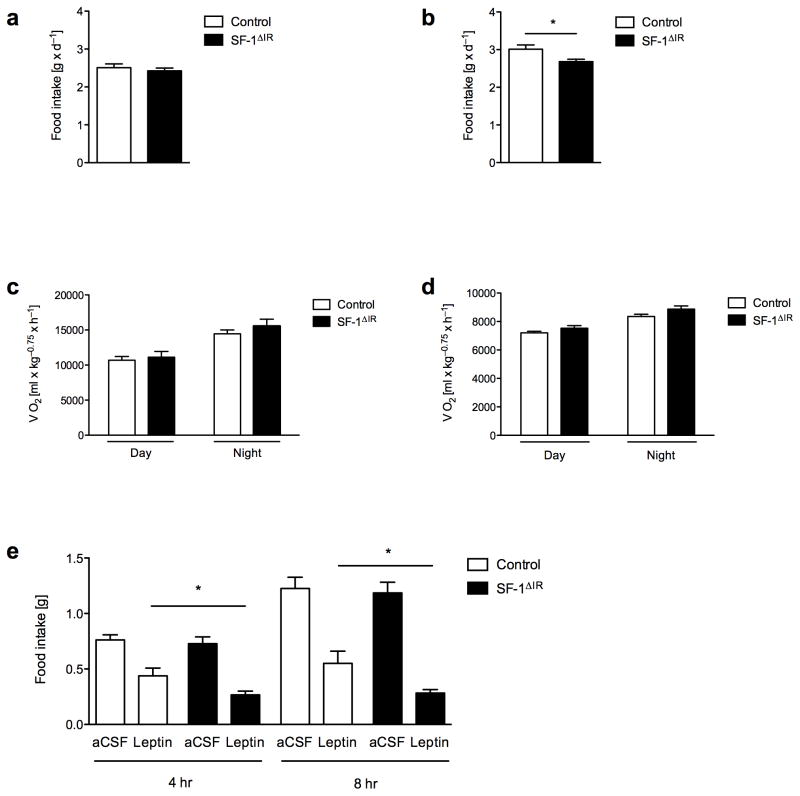
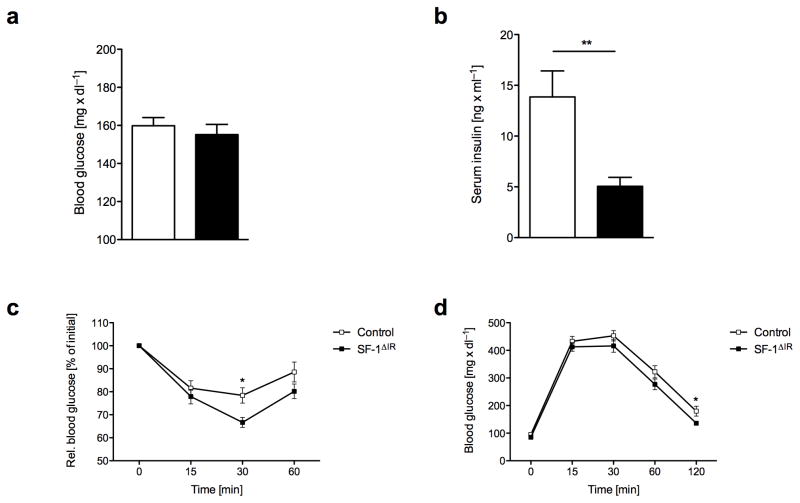
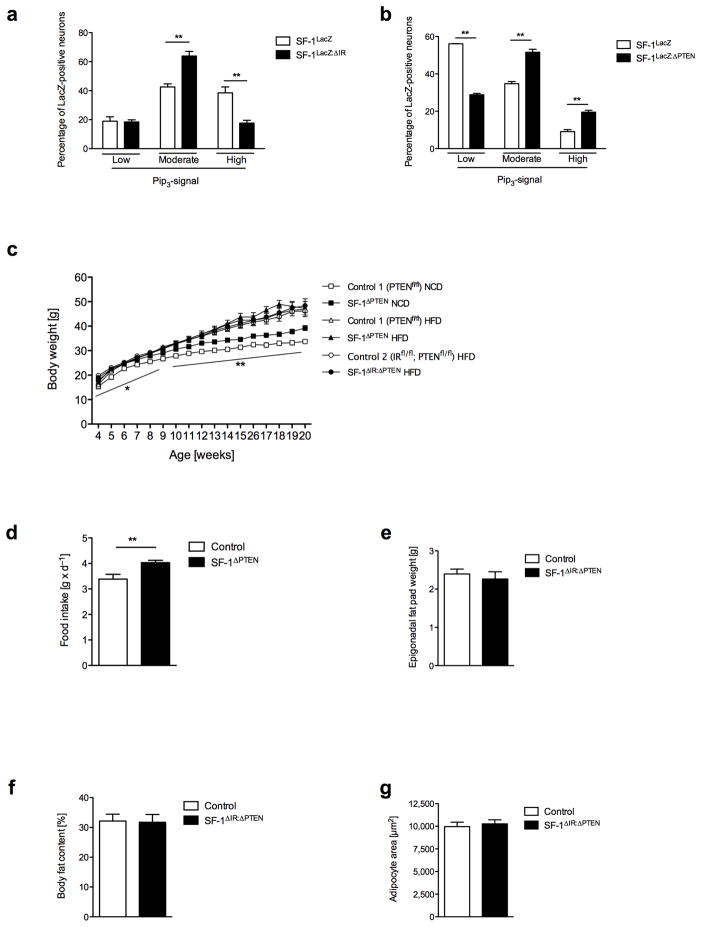
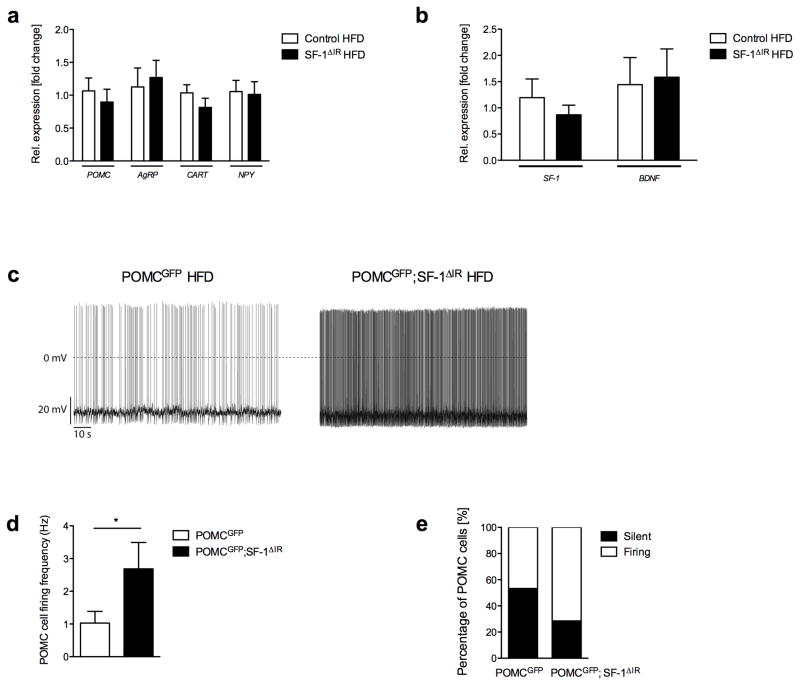
Steroidogenic factor 1 (SF-1)-expressing neurons of the ventromedial hypothalamus (VMH) control energy homeostasis, but the role of insulin action in these cells remains undefined. We show that insulin activates phosphatidylinositol-3-OH kinase (PI3K) signaling in SF-1 neurons and reduces firing frequency in these cells through activation of K(ATP) channels. These effects were abrogated in mice with insulin receptor deficiency restricted to SF-1 neurons (SF-1(ΔIR) mice). Whereas body weight and glucose homeostasis remained the same in SF-1(ΔIR) mice as in controls under a normal chow diet, they were protected from diet-induced leptin resistance, weight gain, adiposity and impaired glucose tolerance. High-fat feeding activated PI3K signaling in SF-1 neurons of control mice, and this response was attenuated in the VMH of SF-1(ΔIR) mice. Mimicking diet-induced overactivation of PI3K signaling by disruption of the phosphatidylinositol-3,4,5-trisphosphate phosphatase PTEN led to increased body weight and hyperphagia under a normal chow diet. Collectively, our experiments reveal that high-fat diet-induced, insulin-dependent PI3K activation in VMH neurons contributes to obesity development.


Figures

Figure 1
Figure 1. Insulin action in VMH neurons and generation of IRΔSF-1-mice
a) SF-1 Cre-mediated recombination was visualized by immunohistochemistry for GFP in brains of SF-1GFP mice. A representative section is shown. b) Double immunohistochemistry for lacZ and PIP3 of ventromedial hypothalamic neurons of SF-1LacZ and SF-1LacZ: ΔIR reporter mice was performed in overnight-fasted animals, which were intravenously injected with either saline or insulin and sacrificed 10 or 20 min after stimulation. A representative section is shown, scale bar = 10μm. Blue (DAPI), DNA; red, β-gal (SF-1 neurons); green, PIP3. c) Quantification of PIP3 immunoreactivity of SF-1 VMH neurons in SF-1LacZ and d) SF-1LacZ: ΔIR reporter mice after saline, or insulin stimulation for either 10 or 20 min. Values are means ± SEM of sections obtained from at least three mice per stimulation and genotype. We counted in total 4400 neurons per genotype and quantification was performed as described in methods. e) In situ hybridisation for IR-mRNA expression in SF-1LacZ and SF-1LacZ: ΔIR reporter mice (red). SF-1 positive cells were visualized by anti-β-galactosidase immunostaining (green) and nuclei were stained by DAPI-staining (blue). Representative sections are shown (scale bar = 10μm) and a quantification of VMH IR-mRNA expression in SF-1LacZ and SF-1LacZ: ΔIR mice normalized to that of SF-1LacZ animals. f) Western blot analysis of IR-β subunit and α-tubulin (loading control) in hypothalamus (HT), rest brain (RB), pituitary (Pit), liver, skeletal muscle (SM), pancreas (Panc), white (WAT) and brown (BAT) adipose tissue in control and SF-1ΔIR-mice (n = 4 in each group).
Figure 2
Figure 2. Effects of insulin on electrical activity of VMH neurons
a) Representative recording of an identified insulin responsive SF-1-positive neuron in a hypothalamic slice from a SF-1GFP mouse before and during addition of 200 nM insulin, followed by application of 200μM tolbutamide b) Representative recording of an identified SF-1-positive neuron from a SF-1GFP: ΔIR mouse before and during addition of 200 nM insulin, followed by application of 200μM tolbutamide. c) Percentage of insulin-response SF-1 neurons from SF-1GFP mice and SF-1GFP: ΔIR mice. d) Membrane potential of identified SF-1 neurons in hypothalamic slices from SF-1GFP mice before and during application of 200nM insulin, followed by addition of 200μM tolbutamide (n= 6 neurons per group). Firing frequency of identified SF-1 neurons in hypothalamic slices from SF-1GFP mice before and during application of 200nM insulin, followed by addition of 200μM tolbutamide (n= 5 neurons per group). e) Membrane potential of identified SF-1 neurons from SF-1GFP: ΔIR mice before and during application of 200nM insulin, followed by addition of 200μM tolbutamide (n= 12 neurons per group). Firing frequency of identified SF-1 neurons from SF-1GFP:ΔIR mice before and during application of 200nM insulin, followed by addition of 200μM tolbutamide (n= 9 neurons per group). Displayed values are means ± S.E.M.; *, p ≤ 0.05; **, p ≤ 0.01.
Figure 3
Figure 3. Protection against diet-induced obesity in SF-1ΔIR-mice
a) Average body weight of male control and SF-1ΔIR-mice on high-fat diet (HFD) and male control mice on normal chow diet (NCD) (n>15 per genotype and diet). b) Epigonadal fat pad of male control and SF-1ΔIR-mice on normal chow diet (NCD) or high-fat diet (HFD) at the age of 20 weeks (n>15 per genotype and diet). c) Body fat content as measured by NMR of male control and SF-1ΔIR-mice on normal chow diet (NCD) or high-fat diet (HFD) at the age of 20 weeks (n>15 per genotype and diet). d) Serum leptin levels of male control and SF-1ΔIR-mice on normal chow diet (NCD) or high-fat diet (HFD) at the age of 8 and 20 weeks (n>15 per genotype and diet). e) Quantification of mean adipocyte surface in epigonadal adipose tissue of male control and SF-1ΔIR-mice on NCD or HFD at the age of 20 weeks (n>3 per group and diet). f) Representative H&E stain of epigonadal adipose tissue of male control and SF-1ΔIR-mice on HFD at the age of 20 weeks. Scale bar = 100 μm. Displayed values are means ± S.E.M.; *, p ≤ 0.05; **, p ≤ 0.01; ***, p ≤ 0.001. § p ≤ 0.01
Figure 4
Figure 4. Increased leptin sensitivity in young SF-1ΔIR-mice
a) Daily food intake of male control and SF-1ΔIR-mice on HFD at the age of 6 to 7 weeks (n> 16 per group) b) Oxygen consumption of male control and SF-1ΔIR-mice on HFD at the age of 6 to 7 weeks (n>16 per group) c) Daily food intake of male control and SF-1ΔIR-mice on HFD at the age of 12 to 13 weeks (n>14 per group). d) Oxygen consumption of male control and SF-1ΔIR-mice on HFD at the age of 13 to 14 weeks (n>14 per group). e) Leptin sensitivity of 7- to 8-week-old male control and SF-1ΔIR-mice on HFD, 4 and 8 hours after overnight fasting and i.c.v. injection of either ACSF or 5μg leptin. *, p ≤ 0.05 in an unpaired, one-tailed student’s t-test. Displayed values are means ± S.E.M.; *, p ≤ 0.05.
Figure 5
Figure 5. Protection against diet-induced insulin resistance in SF-1ΔIR-mice
a) Random fed blood glucose levels male control and SF-1ΔIR-mice on NCD and HFD at the age of 8 and 20 weeks (n>14 per group). b) Serum insulin levels in male control and SF-1ΔIR-mice on NCD and HFD at the age of 8 and 20 weeks (n>14 per group). c) Intraperitoneal insulin tolerance test in male control and SF-1ΔIR-mice on HFD at the age of 14 weeks (n>18 per group). d) ) Intraperitoneal glucose tolerance test in male control and SF-1ΔIR-mice on HFD at the age of 15 weeks (n>18 per group). Displayed values are means ± S.E.M.; *, p ≤ 0.05; **, p ≤ 0.01.
Figure 6
Figure 6. Enhanced PI3kinase activation in the VMH promotes hyperphagia and weight gain
a) Double immunohistochemistry for lacZ and PIP3 of ventromedial hypothalamic neurons of HFD-exposed SF-1LacZ and SF-1LacZ: ΔIR reporter mice was performed after an overnight fast. Shown is the percentage of SF-1 VMH neurons with low, moderate and high PIP3 immunoreactivity (see methods for quantification). (n=3 animals per group). b) Double immunohistochemistry for lacZ and PIP3 of ventromedial hypothalamic neurons of NCD-exposed SF-1LacZ and SF-1LacZ: ΔPTEN reporter mice was performed in overnight-fasted animals. Shown is the quantification of neurons with low, moderate and high PIP3 levels (as displayed in Figure 1b). (n= 3; 2). c) Average body weight of male control and SF-1ΔPTEN-mice on normal chow diet (NCD) or high-fat diet (HFD) (n>12 per genotype and diet), and SF-1ΔIR: ΔPTEN-mice on high-fat diet (HFD). d) Daily food intake of male control and SF-1ΔPTEN mice on NCD at the age of 10 weeks (n=8 per group). e) Epigonadal fat pad mass of male control and SF-1ΔIR: ΔPTEN-mice on high-fat diet (HFD) at the age of 20 weeks (n>13 per genotype). f) Quantification of mean adipocyte surface in epigonadal adipose tissue of male control and SF-1ΔIR: ΔPTEN-mice on HFD at the age of 20 weeks (n>3 per group). g) Body fat content as measured by NMR of male control and SF-1ΔIR: ΔPTEN-mice on high-fat diet (HFD) at the age of 20 weeks (n>13 per genotype). Displayed values are means ± S.E.M.; *, p ≤ 0.05; **, p ≤ 0.01.
Figure 7
Figure 7. Increased firing rate of POMC neurons of SF-1ΔIR-mice compared to controls upon high-fat feeding
a) Hypothalamic mRNA expression of pro-opiomelanocortin (POMC), agouti-related protein (AgRP), neuropeptide y (NPY) and cocaine-and-amphetamine-related transcript (CART) in control and SF-1ΔIR-mice on HFD (n=6 per genotype). b) Hypothalamic mRNA expression of steroidogenic factor (SF)-1 and brain-derived neurotrophic factor (BDNF) in control and SF-1ΔIR-mice on HFD (n=6 per genotype). c) Representative recording traces of POMC neurons in POMCGFP and POMCGFP;SF-1ΔIR-mice on HFD. d) Mean firing frequency of POMC neurons in POMCGFP and POMCGFP;SF-1ΔIR-mice on HFD (n=4–5 animals per genotype; n=13–14 neurons per genotype). *, p ≤ 0.05 in an unpaired, one-tailed Student’s t-test. e) Proportion of silent POMC neurons in POMCGFP and POMCGFP;SF-1ΔIR-mice on HFD (n=4–5 animals per genotype; n=13–14 neurons per genotype). Displayed values are means ± S.E.M.; *, p ≤ 0.05.

Comment in

References

    1. Ikeda Y, Luo X, Abbud R, Nilson JH, Parker KL. The nuclear receptor steroidogenic factor 1 is essential for the formation of the ventromedial hypothalamic nucleus. Mol Endocrinol. 1995;9:478–486. - PubMed
    1. Sadovsky Y, et al. Mice deficient in the orphan receptor steroidogenic factor 1 lack adrenal glands and gonads but express P450 side-chain-cleavage enzyme in the placenta and have normal embryonic serum levels of corticosteroids. Proceedings of the National Academy of Sciences of the United States of America. 1995;92:10939–10943. - PMC - PubMed
    1. Shinoda K, et al. Developmental defects of the ventromedial hypothalamic nucleus and pituitary gonadotroph in the Ftz-F1 disrupted mice. Dev Dyn. 1995;204:22–29. - PubMed
    1. Majdic G, et al. Knockout mice lacking steroidogenic factor 1 are a novel genetic model of hypothalamic obesity. Endocrinology. 2002;143:607–614. - PubMed
    1. Unger TJ, Calderon GA, Bradley LC, Sena-Esteves M, Rios M. Selective deletion of Bdnf in the ventromedial and dorsomedial hypothalamus of adult mice results in hyperphagic behavior and obesity. J Neurosci. 2007;27:14265–14274. - PMC - PubMed

Publication types

MeSH terms