. 2011 Jun 5;43(7):621-9.
doi: 10.1038/ng.848.

Extensive and coordinated transcription of noncoding RNAs within cell-cycle promoters

Affiliations

Extensive and coordinated transcription of noncoding RNAs within cell-cycle promoters

Tiffany Hung et al. Nat Genet. .

Abstract

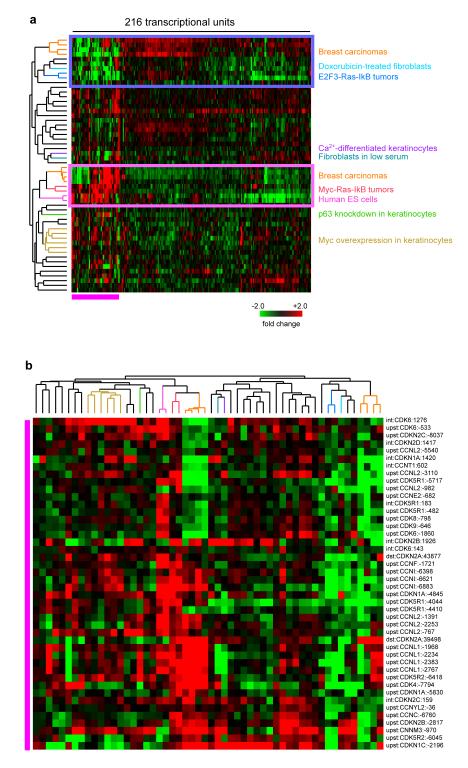
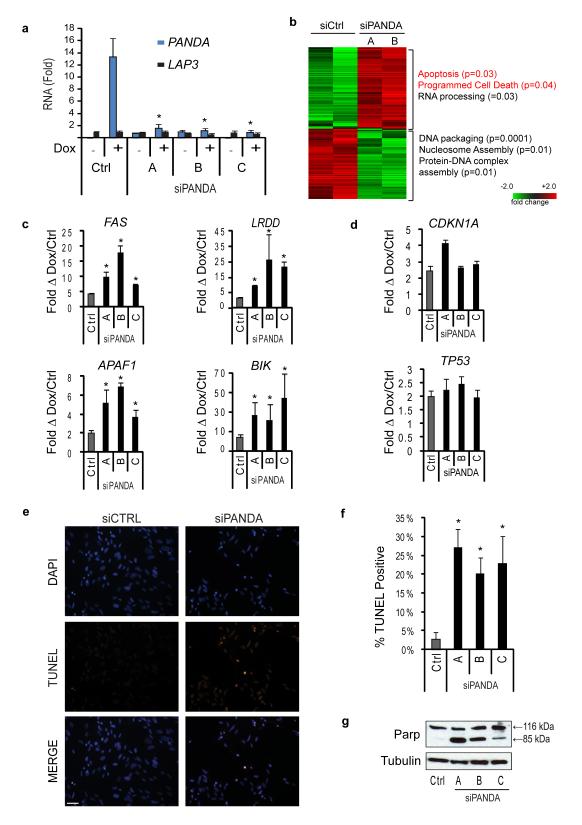
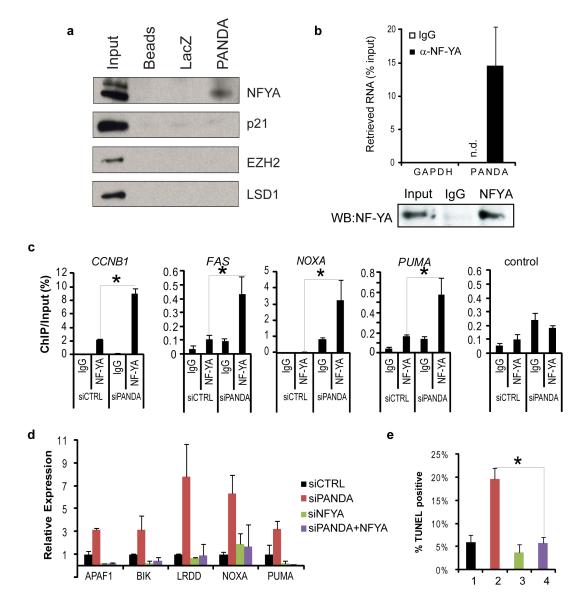
Transcription of long noncoding RNAs (lncRNAs) within gene regulatory elements can modulate gene activity in response to external stimuli, but the scope and functions of such activity are not known. Here we use an ultrahigh-density array that tiles the promoters of 56 cell-cycle genes to interrogate 108 samples representing diverse perturbations. We identify 216 transcribed regions that encode putative lncRNAs, many with RT-PCR-validated periodic expression during the cell cycle, show altered expression in human cancers and are regulated in expression by specific oncogenic stimuli, stem cell differentiation or DNA damage. DNA damage induces five lncRNAs from the CDKN1A promoter, and one such lncRNA, named PANDA, is induced in a p53-dependent manner. PANDA interacts with the transcription factor NF-YA to limit expression of pro-apoptotic genes; PANDA depletion markedly sensitized human fibroblasts to apoptosis by doxorubicin. These findings suggest potentially widespread roles for promoter lncRNAs in cell-growth control.


Figures

Figure 1
Figure 1. Identification of ncRNAs near and within cell cycle genes
(a) Flow chart of strategy for systematic discovery of cell cycle ncRNAs. (b) Representative tiling array data. RNA hybridization intensity and H3K36me3 and H3K4me3 ChIP-chip signal relative to input at the CCNE1 locus in human fetal lung fibroblasts. Predicted transcripts shown in red boxes. Known mRNA exons in black boxes. Peak Calling: Each bar represents a significant peak from one of the 108 array channels. (c) Chromatin state at transcribed regions. Average ChIP-chip signal relative to input calculated across transcriptional peaks expressed in human fetal lung fibroblasts +/- doxorubicin treatment. (d) Codon substitution frequency (CSF) analysis. Graph of average evolutionary CSF of exons of coding genes and predicted transcripts. CSF<10 represents no protein coding potential. (e) Transcriptional landscape of cell cycle promoters. All 56 cell cycle promoters were aligned at the TSS and average RNA hybridization signal was calculated across the 12 kilobase window. This process was repeated with all 49 samples. Output represents a 150 basepair running window of average transcription signal across all 56 promoters and all 54 arrays. See also: Supplementary Table S1 and Supplementary Figure S1.
Figure 2
Figure 2. ncRNA expression across diverse cell cycle perturbations
(a) Hierarchical clustering of 216 predicted ncRNAs across 54 arrays, representing 108 conditions. Red indicates that the cell cycle perturbation induced transcription of the ncRNA. Green indicates that the cell cycle perturbation repressed transcription of the ncRNA. Black indicates no significant expression change. (b) Zoom in view of ncRNAs in cluster 1. See also: Supplementary Table S2 and S3.
Figure 3
Figure 3. Functional associations of ncRNAs
(a) lncRNA expression patterns do not correlate with that of the mRNAs in cis. Histogram of Pearson correlations between each of the 216 ncRNAs and the cis mRNA across 108 samples. (b) lncRNA expression patterns have positive correlation with neighboring lncRNA transcripts. Histogram of Pearson correlations between each of the 216 ncRNAs and nearby transcripts on the same locus across 108 samples. (c) Genes co-expressed with lncRNAs are enriched for functional groups in cell cycle and DNA damage response. Module map of lncRNA gene sets (columns) versus Gene Ontology Biological Processes gene sets (rows) across 17 samples (p<0.05, FDR<0.05). A yellow entry indicates that the GO gene set is positively associated with the lncRNA gene set. A blue entry indicates that the GO gene set is negatively associated with the lncRNA gene set. Black entry indicates no significant association. Representative enriched GO gene sets listed.
Figure 4
Figure 4. Validated expression of ncRNAs in cell cycle progression, ES cell differentiation, and human cancers
Custom Taqman probes were generated and used to interrogate independent biological samples for lncRNA expression. Periodic expression of lncRNAs (blue) during synchronized cell cycle progression in HeLa cells (a) and foreskin fibroblasts (b). Cell cycle phases are confirmed by FACS and expression of genes with known periodic expression in the cell cycle (orange). (c) Regulated expression of lncRNAs in human ES cells vs. fetal pancreas. (d) Differential expression of lncRNAs in normal breast epithelium vs. breast cancer.
Figure 5
Figure 5. ncRNAs at CDKN1A locus are induced by DNA damage
(a) Top: map of all detected transcripts at the CDKN1A promoter. Middle two tracks: Example of RNA hybridization intensity in control or 24 hour doxorubicin treated (200ng/ml) human fetal lung fibroblasts. Note, not all DNA damage inducible transcripts are observed in one single time point. Bottom track: p53 ChIP-chip signal relative to input confirmed the p53 binding site immediately upstream of the CDKN1A TSS upon DNA damage. RACE clone of upst:CDKN1A:-4845 closely matches predicted transcript on tiling array. See also: Supplementary Fig S7. (b) Quantitative RT-PCR of lncRNAs shows coordinate induction or repression across a 24 hour time course of doxorubicin treatment. A cluster of lncRNAs transcribed from the CDKN1A locus are induced. (c) Expression of transcripts from the CDKN1A locus over a 24 hour time course after doxorubicin-treatment of normal human fibroblasts (FL3). See also: Supplementary Fig S6. (d) Northern blot of PANDA confirms transcript size of 1.5Kb. (e) Doxorubicin induction of PANDA requires p53 but not CDKN1A. Mean + s.d. are shown, *p<0.05 relative to sictrl, student’s t-test. (f) Expression of wild type p53 in p53-null H1299 cells restores DNA damage induction of CDKN1A and PANDA. p53(V272C) loss-of-function mutant fails to restore induction, whereas a gain-of-function Li-Fraumeni allele, p53(R273H), selectively retains the ability to induce PANDA.
Figure 6
Figure 6. PANDA lncRNA regulates apoptotic response to DNA damage
(a) siRNA knockdown of PANDA in the presence of DNA damage with doxorubicin in human fibroblasts (FL3), Custom siRNAs specifically target PANDA with no discernable effect on the LAP3 mRNA. Mean + s.d. are shown in all bar graphs. * indicates p<0.05 compared to siCTRL for all panels, student’s t-test (b) Heat map of gene expression changes with siPANDA relative to control siRNA at 24 hours of doxorubicin treatment in FL3 cells. (c) Quantitative RT-PCR of canonical apoptosis pathway genes reveals induction with siPANDA relative to control siRNA at 28 hours of doxorubicin treatment (FL3). (d) Quantitative RT-PCR of CDKN1A and TP53 in FL3 cells reveal no reduction in expression with siPANDA relative to control siRNA. (e) TUNEL immunofluorescence of control and siPANDA FL3 fibroblasts at 28 hours of doxorubicin treatment. Scale bar= 20μm. (f) Quantification of 3 independent TUNEL assays. p<0.05 for each siPANDA sample compared to siCTRL, student’s t-test. (g) Western blot of PARP cleavage in control and PANDA siRNA FL3 fibroblasts at 24 hours of doxorubicin treatment.
Figure 7
Figure 7. PANDA regulates transcription factor NF-YA
(a) RNA chromatography of PANDA from doxorubicin-treated FL3 cell lysates. Retrieved proteins are visualized by immunoblot analysis. (b) Immunoprecipitation of NF-YA from doxorubicin-treated FL3 lysates specifically retrieves PANDA as measured by qRT-PCR. Bottom: Immunoblot confirms IP of NF-YA. (c) ChIP of NF-YA in FL3 fibroblasts nucleofected with siCTRL or siPANDA. ChIP-qPCR at known NF-YA target sites on promoters of CCNB1, FAS, NOXA, PUMA, or a control downstream region in FAS promoter lacking the NF-YA motif. Mean + s.d. are shown in all bar graphs. * indicates p<0.05 , student’s t-test (d) Concomitant knockdown of NF-YA attenuates induction of apoptotic genes by PANDA depletion as measured by qRT-PCR. For knockdown efficiency see Fig. S11. (e) Concomitant knockdown of NF-YA rescues apoptosis induced by PANDA depletion. Quantification of TUNEL staining is shown. Figure legend as in (D).
Figure 8
Figure 8. Model of coding and noncoding transcripts at the CDKN1A locus coordinating the DNA damage response
Upon DNA damage, p53 binding at the CDKN1A locus coordinately activates transcription of CDKN1A as well as noncoding transcripts PANDA and linc-p21. CDKN1A mediates cell cycle arrest, PANDA blocks apoptosis through NF-YA, and linc-p21 mediates gene silencing through recruitment of hnRPK.

Comment in

  • The long reach of noncoding RNAs.
    Sotillo E, Thomas-Tikhonenko A. Sotillo E, et al. Nat Genet. 2011 Jun 28;43(7):616-7. doi: 10.1038/ng.870. Nat Genet. 2011. PMID: 21709680 Free PMC article.

References

    1. Bertone P, et al. Global identification of human transcribed sequences with genome tiling arrays. Science. 2004;306:2242–6. - PubMed
    1. Carninci P, et al. The transcriptional landscape of the mammalian genome. Science. 2005;309:1559–63. - PubMed
    1. Calin GA, et al. Ultraconserved regions encoding ncRNAs are altered in human leukemias and carcinomas. Cancer Cell. 2007;12:215–29. - PubMed
    1. Carninci P. Non-coding RNA transcription: turning on neighbours. Nat Cell Biol. 2008;10:1023–4. - PubMed
    1. Mattick JS, Makunin IV. Small regulatory RNAs in mammals. Hum Mol Genet. 2005;14(Spec No 1):R121–32. - PubMed

Publication types

MeSH terms

Associated data