. 2011 Aug;44(4):360-71.
doi: 10.1111/j.1365-2184.2011.00758.x. Epub 2011 Jun 6.

Cholesterol esters as growth regulators of lymphocytic leukaemia cells

Affiliations

Cholesterol esters as growth regulators of lymphocytic leukaemia cells

M F Mulas et al. Cell Prolif. 2011 Aug.

Abstract

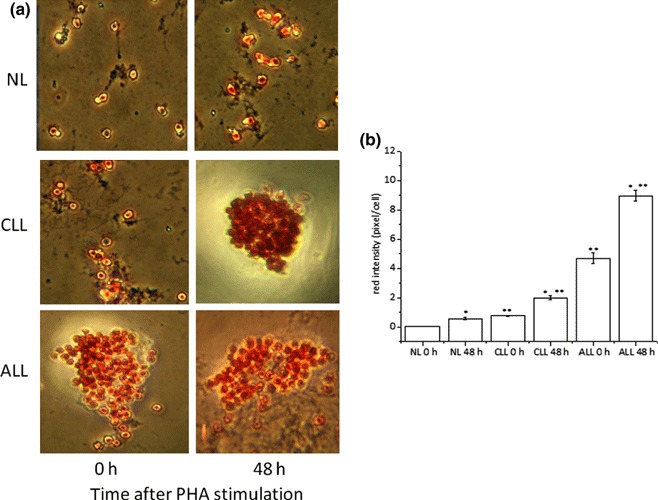
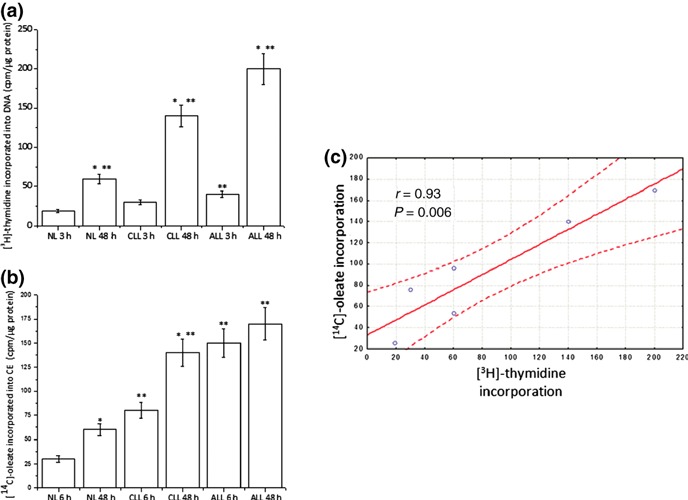
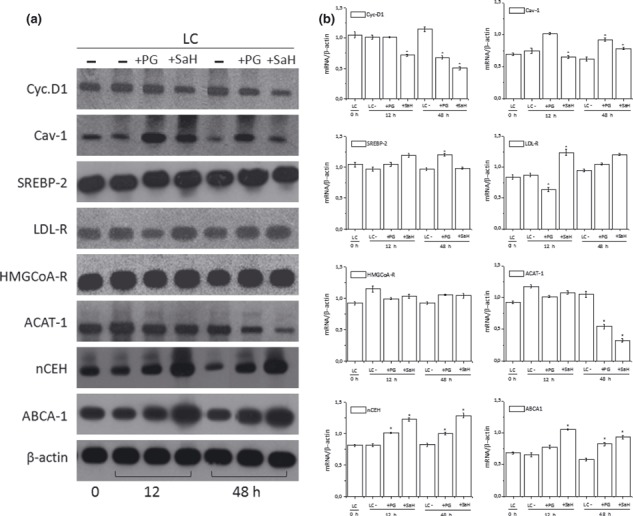
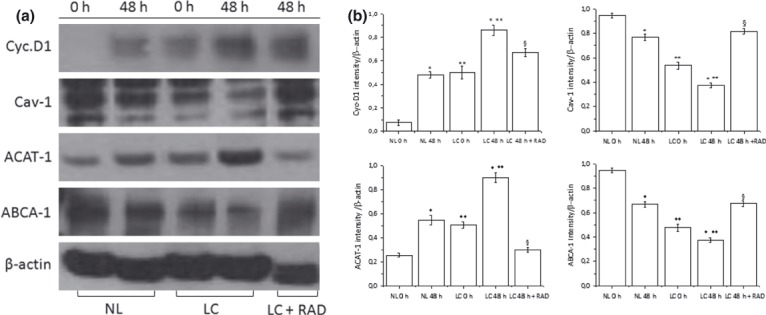
Objective: Alterations in plasma lipid profile and in intracellular cholesterol homoeostasis have been described in various malignancies; however, significance of these alterations, if any, in cancer biology is not clear. The aim of the present study was to investigate a possible correlation between alterations in cholesterol metabolism and expansion of leukaemia cell numbers.

Materials and methods: Lipid profiles in plasma and in primary leukaemia cells isolated from patients with acute or chronic lymphocytic leukaemia (ALL and CLL) were studied.

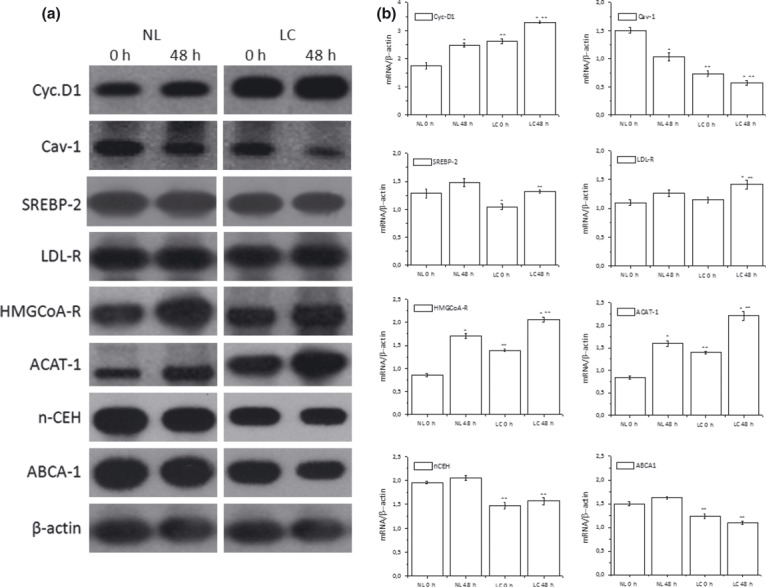
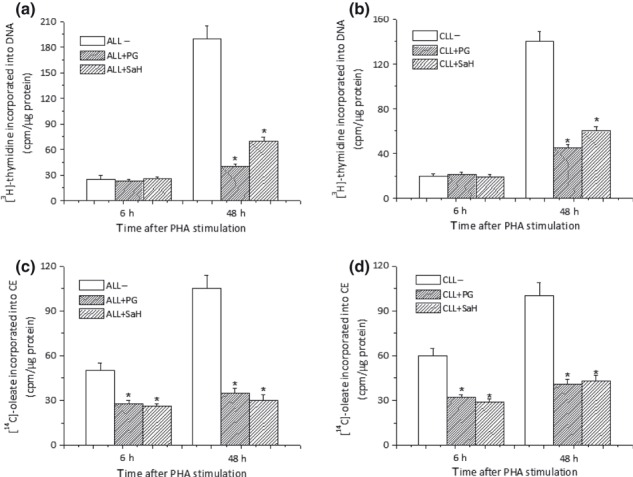
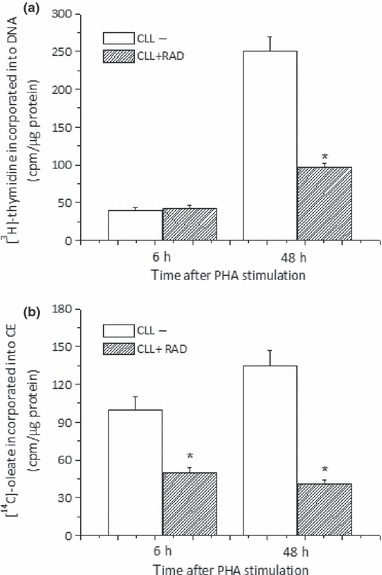
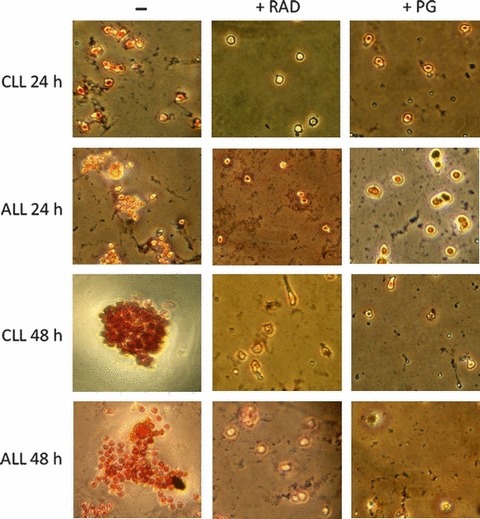
Results and conclusions: Decreased levels of HDL-C were observed in plasma of leukaemic patients, levels of total cholesterol, LDL-C, triglycerides and phospholipids were unchanged or only slightly increased. As compared to normal lymphocytes, freshly isolated leukaemic cells showed increased levels of cholesterol esters and reduction in free cholesterol. Growth stimulation of ALL and CLL cells with phytohemagglutinin led to further increase in levels of cholesterol esters. Conversely, treatment with an inhibitor of cell proliferation such as the mTOR inhibitor, RAD, caused decline in population growth rate of leukaemia cells, which was preceded by sharp reduction in rate of cholesterol esterification. On the other hand, exposure of leukaemic cells to two inhibitors of cholesterol esterification, progesterone and SaH 58-035, caused 60% reduction in their proliferation rate. In addition to demonstrating tight correlation between cell number expansion and cholesterol esterification in leukaemic cells, these results suggest that pathways that control cholesterol esterification might represent a promising targets for novel anticancer strategies.


Figures

Figure 1
Figure 1
 ORO staining of cytoplasmic neutral lipids. NL and LC were incubated for 0–48 h with PHA and then stained with ORO to demonstrate neutral lipids and counterstained with haematoxylin for nuclei. Cells were then examined by light microscopy and two different fields per sample were imaged. Red ORO intensity was measured in these two fields using NIH Image J software. Panel (a) shows representative images of ORO stained NL and LC cultures. Panel (b) shows red intensity expressed as mean pixels ± SD/cell. *P < 0.05 versus corresponding 0 h **P < 0.05 versus corresponding NL.
Figure 2
Figure 2
 [3H]thymidine and [14C]‐oleate incorporation of leukaemic cells. NL and LC isolated from patients affected by CLL and ALL were incubated at 37 °C in RPMI‐1640‐10% FCS supplemented with PHA (10 μg/ml) for 48 h. Cells were incubated with [3H]thymidine (panel a) and [14C]‐oleate (panel b) 3 and 6 h before harvesting respectively. Data are means ± SD of triplicate determinations from a single normal subject and a single leukaemic patient and are representative of three separate subjects for each group. Panel b: Pearson’s correlation ([3H]thymidine incorporation versus [14C]‐oleate incorporation). *P < 0.05 versus corresponding 3 or 6 h **P < 0.05 versus corresponding NL.
Figure 3
Figure 3
 RT‐PCR analyses in NL and LC. Total mRNA was extracted from normal lymphocytes (NL) and leukaemic cells (LC). mRNA levels of indicated genes were determined by RT‐PCR using appropriate primer sets. Specific bands were detected after addition of a chemiluminescent substrate, and analysed using NIH Image 1.63 program (Scion Image). Panel a: blots of target genes, representative of NL and LC isolated from three different subjects for each group. Panel b: densitometric analysis of mRNA levels of NL and LC normalized for endogenous β‐actin mRNA. Histograms represent means ± SD of densitometric scans of triplicate determinations expressed as target gene/β‐actin. *P < 0.05 versus corresponding 0 h **P < 0.05 versus corresponding NL.
Figure 4
Figure 4
 SaH and Pg cause inhibition of cell growth. Freshly isolated ALL and CLL cells were stimulated with PHA in presence or in absence of either PG (10 μm) or SaH (4 μm) and harvested 6 or 48 h later. Cultures were incubated with [3H]‐thymidine (a and b) and [14C]‐oleate (c and d) 6 h before harvest. Histograms represent mean ± SD of triplicate determinations and are representative of 10 different patients (7 CLL and 3 ALL). *P < 0.05 versus untreated cells.
Figure 5
Figure 5
 RT‐PCR analyses in LC treated with inhibitors of cholesterol esterification. Total mRNA was extracted from LC and mRNA levels of indicated genes were determined by RT‐PCR using appropriate primer sets. Specific bands were detected after addition of a chemiluminescent substrate, and analysed using NIH Image 1.63 program (Scion Image).). Panel a: blots of target genes, representative of LC treated with or without PG (10 μm) or SaH (4 μm) isolated from three different patients. Panel b: densitometric analysis of mRNA levels of LC normalized for endogenous β‐actin mRNA. Histograms represent mean ± SD of densitometric scans of triplicate determinations expressed as target gene/β‐actin. *P < 0.05 versus corresponding untreated LC.
Figure 6
Figure 6
 RAD induces inhibition of cholesterol esterification. Freshly isolated CLL cells were stimulated with PHA in presence or in absence of RAD (20 nm) and harvested 6 or 48 h later. [3H]‐thymidine (a) and [14C]‐oleate (b) were added 6 h before harvest. Histograms represent mean ± SD of triplicate determinations and are representative of six different patients *P < 0.05 versus untreated cells.
Figure 7
Figure 7
 Neutral lipids in RAD and PG‐treated LC. Freshly isolated ALL and CLL cells were stimulated with PHA in presence or in absence of either RAD (20 nm) or PG (10 μm) and harvested 24 or 48 h later. Then, cells were fixed, stained with ORO for neutral lipids and counterstained with haematoxylin for nuclei.
Figure 8
Figure 8
 Effect of RAD on protein expression of Cyc.‐D1, Cav.‐1, ACAT‐1 and ABCA‐1 in LC. Freshly isolated LC were stimulated with PHA for 48 h in presence or in absence of RAD (20 nm). β‐actin served as housekeeper gene. (a) Protein levels of Cyc.‐D1, Cav.‐1, ACAT‐1 and ABCA‐1 examined by western blotting (b). Histograms represent means ± SD of the densitometric scans of protein bands from triplicate determinations, representative of six different subjects (three normal and three leukaemic) expressed as intensity of target gene/β‐actin. *P < 0.05 versus corresponding 0 h **P < 0.05 versus corresponding NL. §P < 0.05 versus 48 h untreated LC.

References

    1. Roffo AH (1916) Montevideo: An. Facult. Med..
    1. Roffo AH (1933) Heliotropism of cholesterol in relation to skin cancer. Am. J. Cancer. 17, 42–57.
    1. Roffo AH, Pilar F (1930) Bol. Inst. Med.Eexp. Estud. y Trat. Cancer 7, 22
    1. Yasuda M, Bloor WR (1932) Lipid content of tumors. J. Clin. Invest. 11, 677. - PMC - PubMed
    1. Pani A, Dessi S (2003) Cell growth and cholesterol ester. Springer Publication 1–11, 1–150.

Publication types

MeSH terms