. 2011 Jun 6:12:293.
doi: 10.1186/1471-2164-12-293.

RNA-seq: technical variability and sampling

Affiliations

RNA-seq: technical variability and sampling

Lauren M McIntyre et al. BMC Genomics. .

Abstract

Background: RNA-seq is revolutionizing the way we study transcriptomes. mRNA can be surveyed without prior knowledge of gene transcripts. Alternative splicing of transcript isoforms and the identification of previously unknown exons are being reported. Initial reports of differences in exon usage, and splicing between samples as well as quantitative differences among samples are beginning to surface. Biological variation has been reported to be larger than technical variation. In addition, technical variation has been reported to be in line with expectations due to random sampling. However, strategies for dealing with technical variation will differ depending on the magnitude. The size of technical variance, and the role of sampling are examined in this manuscript.

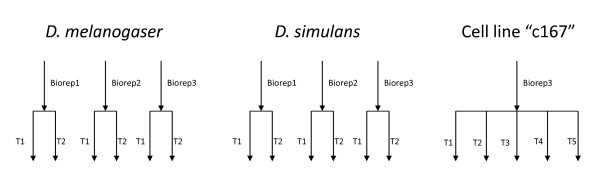
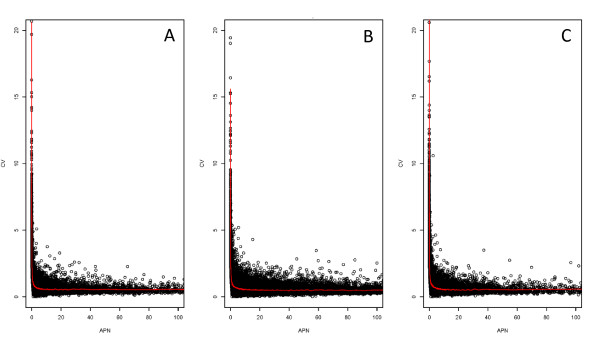
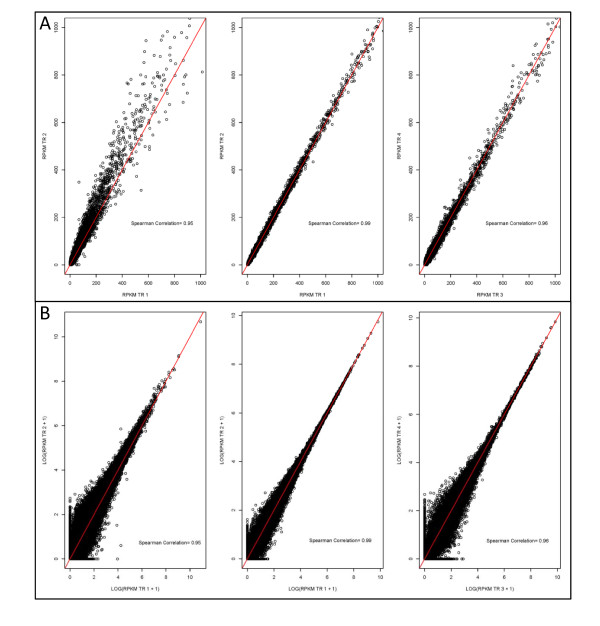
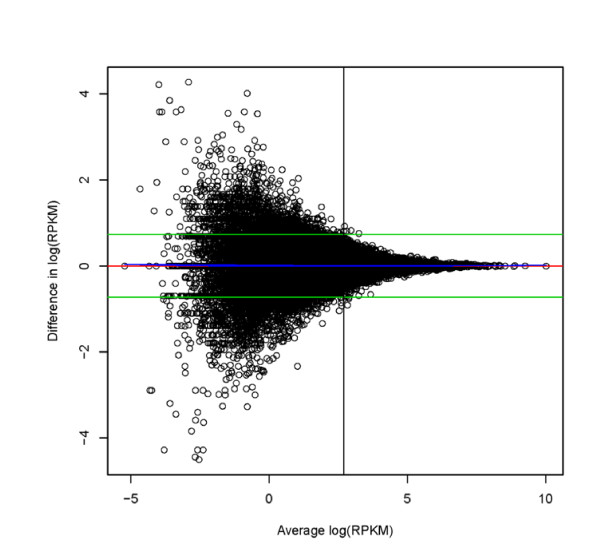
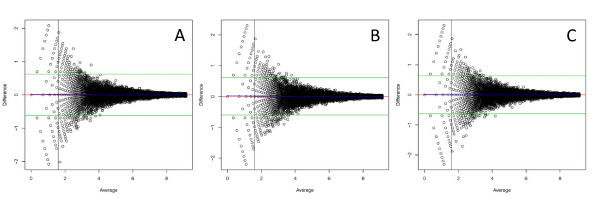
Results: In this study three independent Solexa/Illumina experiments containing technical replicates are analyzed. When coverage is low, large disagreements between technical replicates are apparent. Exon detection between technical replicates is highly variable when the coverage is less than 5 reads per nucleotide and estimates of gene expression are more likely to disagree when coverage is low. Although large disagreements in the estimates of expression are observed at all levels of coverage.

Conclusions: Technical variability is too high to ignore. Technical variability results in inconsistent detection of exons at low levels of coverage. Further, the estimate of the relative abundance of a transcript can substantially disagree, even when coverage levels are high. This may be due to the low sampling fraction and if so, it will persist as an issue needing to be addressed in experimental design even as the next wave of technology produces larger numbers of reads. We provide practical recommendations for dealing with the technical variability, without dramatic cost increases.


Figures

Figure 1
Figure 1
Experimental Design. A figure showing the design of the three experiments evaluated here. Biological replicates are separate individuals used for library construction. Technical replicates for the D. melanogaster female heads and D. simulans male heads data are a single library run on multiple lanes. For D. melanogaster c167 cell lines the exact nature of the technical replication is uncertain.
Figure 2
Figure 2
Library construction and sequencing. Beginning with 100 ng of mRNA the manufacturer's protocol is used to estimate a sampling fraction.
Figure 3
Figure 3
Coefficient of variation (CV) plotted on Y axis and average depth per nucleotide (APN) on X axis. Points with average depth of greater than 1000 are not displayed. Panel A is D. simulans BR2 TR2. Panel B is D. melanogaster female heads BR2 TR1. Panel C is TR1 for cell line c 167. Note that despite the difference in the number of mappable reads, the pattern of CV against the mean remains the same. CVs are very large when the average expression is low. Individual points represent exonic regions (Flybase 5.4) cubic smoothing line fit using R's smooth.spline function.
Figure 4
Figure 4
Scatterplot of technical replicates. Points where RPKM is 1000 or less are displayed (A). The red line is the 45 degree line. Left panel is D. simulans male heads BR2, middle panel is D. melanogaster female heads BR2 and right panel is D. melanogaster cell line c167 Tr3 vs TR4. Spearman correlation values are (0.95, 0.99, 0.96), respectively. Scatterplot of technical replicates on the log scale (log(RPKM+1)) for RPKM values of less than 1000) (B). The red line is the 45 degree line. Left panel is D. simulans male heads BR2, middle panel is D. melanogaster female heads BR2 and right panel is D. melanogaster cell line c167 Tr3 vs TR4. Spearman correlation values are (0.95, 0.99, 0.96), respectively.
Figure 5
Figure 5
Bland-Altman plot showing level of agreement between technical replicates for natural log transformed RPKM D. simulans biological replicate 3. On the Y axis is the difference between technical replicates and on the X axis is the average between technical replicates. Green lines are the average of all differences +/- 1.96 (standard deviation of the differences). The red line is drawn at zero. The blue line is a loess fit. The discrepancy between technical replicates is a function of the estimated expression level. The horizontal line is drawn at an average coverage per nucleotide of 5. Bland-Altman plots for all the remaining comparisons among technical replicates are in Additional file 11.
Figure 6
Figure 6
Bland-Altman plot for simulated data. The data were log transformed and the average of the two technical replicates is on the X axis and the difference between technical replicates is on the Y axis. (A) Simulated replicates 1 versus 2. (B) Simulated replicates 1 versus 3. (C) Simulated replicates 2 versus 3. Green lines are the average of all differences +/- 1.96 (standard deviation of the differences). The red line is drawn at zero. The blue line is a lowess fit.

References

    1. Shendure J. The beginning of the end for microarrays? Nat Methods. 2008;5:585–587. doi: 10.1038/nmeth0708-585. - DOI - PubMed
    1. Asmann Y, Klee E, Thompson EA, Perez E, Middha S, Oberg A, Therneau T, Smith D, Poland G, Wieben E, Kocher JP. 3' tag digital gene expression profiling of human brain and universal reference RNA using Illumina Genome Analyzer. BMC Genomics. 2009;10:531. doi: 10.1186/1471-2164-10-531. - DOI - PMC - PubMed
    1. Mortazavi A, Williams BA, McCue K, Schaeffer L, Wold B. Mapping and quantifying mammalian transcriptomes by RNA-Seq. Nat Methods. 2008;5:621–628. doi: 10.1038/nmeth.1226. - DOI - PubMed
    1. Pickrell JK, Marioni JC, Pai AA, Degner JF, Engelhardt BE, Nkadori E, Veyrieras J, Stephens M, Gilad Y, Pritchard JK. Understanding mechanisms underlying human gene expression variation with RNA sequencing. Nature. 2010;464:768–772. doi: 10.1038/nature08872. - DOI - PMC - PubMed
    1. Sultan M, Schulz MH, Richard H, Magen A, Klingenhoff A, Scherf M, Seifert M, Borodina T, Soldatov A, Parkhomchuk D, Schmidt D, O'Keefe S, Haas S, Vingron M, Lehrach H, Yaspo ML. A Global View of Gene Activity and Alternative Splicing by Deep Sequencing of the Human Transcriptome. Science. 2008;321:956–960. doi: 10.1126/science.1160342. - DOI - PubMed

Publication types