. 2011 Aug 5;411(1):286-97.
doi: 10.1016/j.jmb.2011.05.033. Epub 2011 May 30.

Dynamics may significantly influence the estimation of interatomic distances in biomolecular X-ray structures

Affiliations

Dynamics may significantly influence the estimation of interatomic distances in biomolecular X-ray structures

Antonija Kuzmanic et al. J Mol Biol. .

Abstract

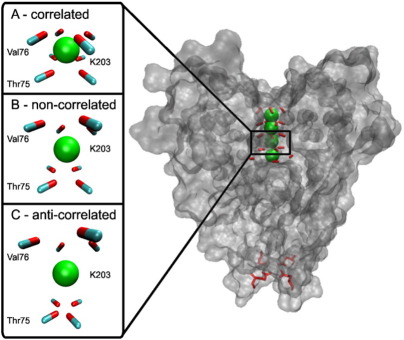
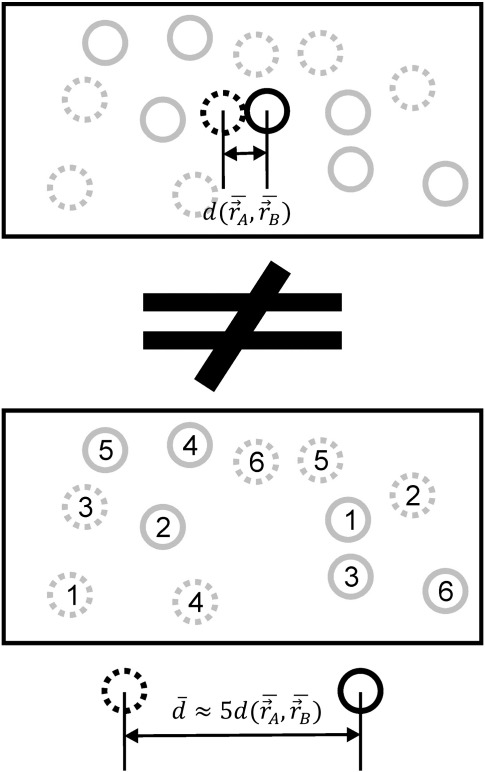
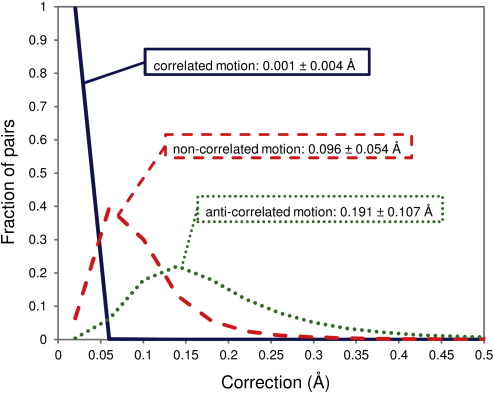
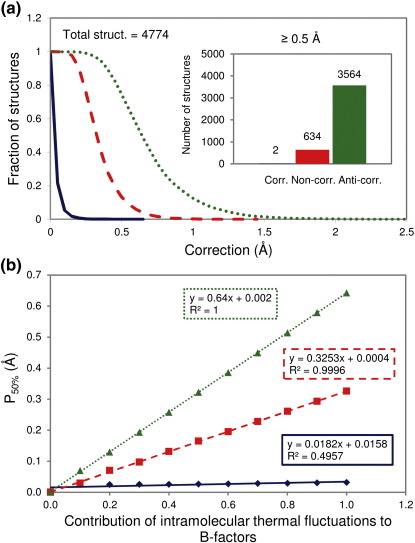
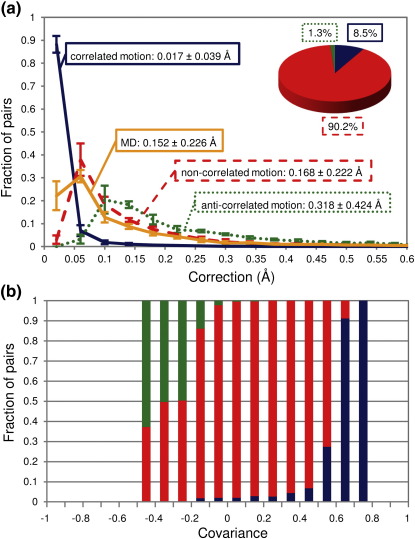
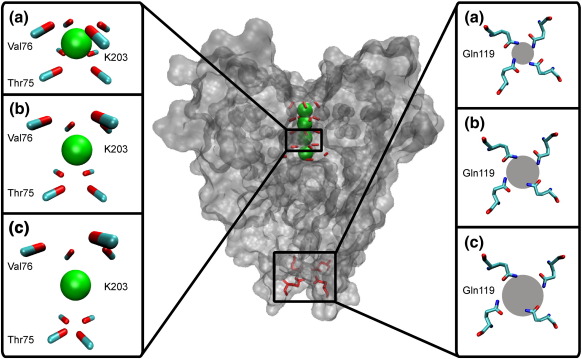
Atomic positions obtained by X-ray crystallography are time and space averages over many molecules in the crystal. Importantly, interatomic distances, calculated between such average positions and frequently used in structural and mechanistic analyses, can be substantially different from the more appropriate time-average and ensemble-average interatomic distances. Using crystallographic B-factors, one can deduce corrections, which have so far been applied exclusively to small molecules, to obtain correct average distances as a function of the type of atomic motion. Here, using 4774 high-quality protein X-ray structures, we study the significance of such corrections for different types of atomic motion. Importantly, we show that for distances shorter than 5 Å, corrections greater than 0.5 Å may apply, especially for noncorrelated or anticorrelated motion. For example, 14% of the studied structures have at least one pair of atoms with a correction of ≥0.5 Å in the case of noncorrelated motion. Using molecular dynamics simulations of villin headpiece, ubiquitin, and SH3 domain unit cells, we demonstrate that the majority of average interatomic distances in these proteins agree with noncorrelated corrections, suggesting that such deviations may be truly relevant. Importantly, we demonstrate that the corrections do not significantly affect stereochemistry and the overall quality of final refined X-ray structures, but can provide marked improvements in starting unrefined models obtained from low-resolution X-ray data. Finally, we illustrate the potential mechanistic and biological significance of the calculated corrections for KcsA ion channel and show that they provide indirect evidence that motions in its selectivity filter are highly correlated.


Figures

None
Graphical abstract
Fig. 1
Fig. 1
Interatomic distances calculated from average atomic positions may significantly differ from time-average and ensemble-average distances. To illustrate this, we show a simple system with the positions of two gray circles over time (continuous and broken). In the upper rectangle, the average positions of the two circles are shown in black, and their distance is marked with d(rA,rB). In the lower rectangle, the distance between circles is calculated for each time point and then averaged linearly over time. The average distance is shown in black; for this system, it is actually five times greater than the distance between the average positions d5d(rA,rB).
Fig. 2
Fig. 2
Distributions of corrections to distances between average atomic positions calculated for a collection of X-ray structures (4774 structures) assuming different types of interatomic motion: correlated (continuous blue curve), noncorrelated (broken red curve), and anticorrelated (dotted green curve), with their arithmetic means and standard deviations. All values were binned in 0.04-Å bins to generate the distributions.
Fig. 3
Fig. 3
(a) Fraction of structures that have at least one pair of atoms for which the correction is equal to or greater than a given value (in steps of 0.05 Å), assuming three types of motion: correlated (continuous blue curve), noncorrelated (broken red curve), and anticorrelated (dotted green curve). Inset: Exact numbers are given for corrections greater than 0.5 Å, with the same color code. (b) Cutoff where 50% of the structures exhibit at least one interatomic distance with a correction greater than or equal to it (P50%), as a function of the contribution of intramolecular thermal fluctuations to B-factors (the color code for types of motion is the same as in (a)).
Fig. 4
Fig. 4
(a) Distributions of corrections to interatomic distances calculated for structures obtained from MD simulations of the unit cell of ubiquitin's crystal, assuming three different types of motion: correlated (continuous blue curve), noncorrelated (broken red curve), and anticorrelated (dotted green curve). The distribution of differences between average interatomic distances and distances from average positions (also obtained directly from MD simulations) is shown as a continuous orange curve, with the arithmetic means and standard deviations for every distribution also given. All the values were binned in 0.04-Å bins to generate the distributions. Inset: Relationship between average instantaneous distances and corrections, assuming different types of motion. The percentage of atomic pairs whose average distance is closest to the one obtained from the corrections: 8.5% for correlated motion (blue), 90.2% for noncorrelated motion (red), and 1.3% for anticorrelated motion (green). (b) Normalized positional covariances between pairs of atoms used for calculations from an MD simulation of ubiquitin's crystallographic unit cell. Values are binned in 0.1 bins and color coded according to the closeness of the average distance to the correction for a specific type of motion (correlated, blue; noncorrelated, red; anticorrelated, green).
Fig. 5
Fig. 5
Configurations based on average interatomic distances obtained by correcting distances between average positions in two locations of the KcsA ion channel (PDB ID: 1J95). The corrections on the left-hand side of the figure are calculated for the carbonyl group (carbon atom, light blue; oxygen atom, red) of Thr75 and Val76 (in the selectivity filter) and the potassium ion K203 (green), and they represent one possible structure of the particular part of the filter assuming different types of motion: (a) correlated, (b) noncorrelated, and (c) anticorrelated. On the right-hand side of the figure, the corrections are calculated for the Nε atoms (dark blue) of Gln119 located at the end of the channel's cavity (the gate), also assuming various types of motion. The radii of gray circles are averages of distances between the opposite Nε atoms. All the structures in the figure have been prepared by VMD version 1.8.6.

References

    1. Chruszcz M., Wlodawer A., Minor W. Determination of protein structures—a series of fortunate events. Biophys. J. 2008;95:1–9. - PMC - PubMed
    1. Kruschel D., Zagrovic B. Conformational averaging in structural biology: issues, challenges and computational solutions. Mol. Biosyst. 2009;5:1606–1616. - PubMed
    1. Busing W.R., Levy H.A. The effect of thermal motion on estimation of bond lengths from diffraction measurements. Acta Crystallogr. 1964;17:142–146.
    1. Watkin D. Structure refinement: some background theory and practical strategies. J. Appl. Crystallogr. 2008;41:491–522.
    1. Bürgi H.B. Motion and disorder in crystal structure analysis: measuring and distinguishing them. Annu. Rev. Phys. Chem. 2000;51:275–296. - PubMed

Publication types

MeSH terms

LinkOut - more resources