. 2011 Aug;39(15):e103.
doi: 10.1093/nar/gkr425. Epub 2011 Jun 6.

Systematic bias in high-throughput sequencing data and its correction by BEADS

Affiliations

Systematic bias in high-throughput sequencing data and its correction by BEADS

Ming-Sin Cheung et al. Nucleic Acids Res. 2011 Aug.

Abstract

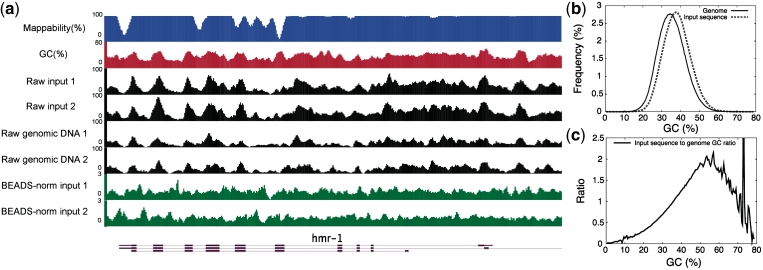
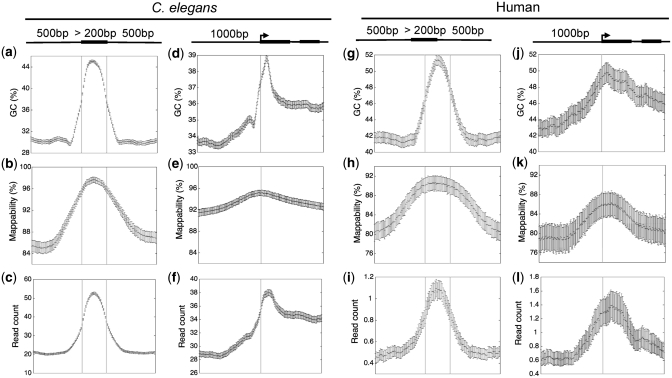
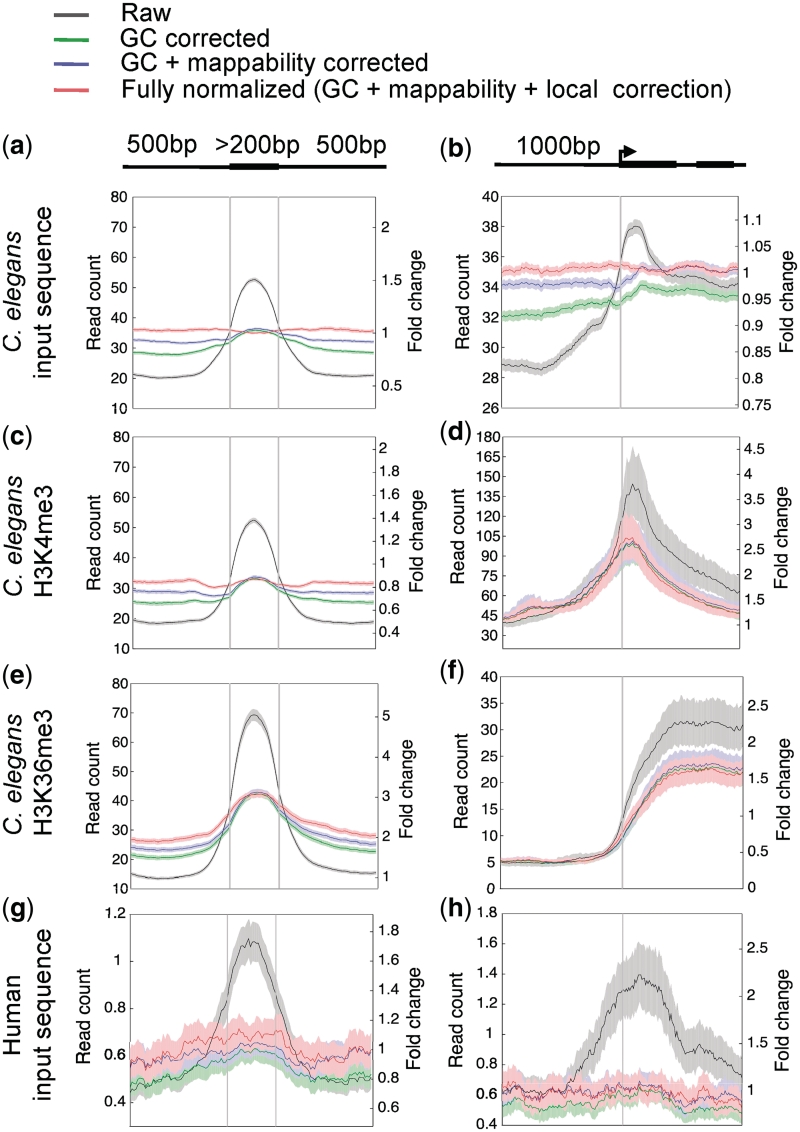
Genomic sequences obtained through high-throughput sequencing are not uniformly distributed across the genome. For example, sequencing data of total genomic DNA show significant, yet unexpected enrichments on promoters and exons. This systematic bias is a particular problem for techniques such as chromatin immunoprecipitation, where the signal for a target factor is plotted across genomic features. We have focused on data obtained from Illumina's Genome Analyser platform, where at least three factors contribute to sequence bias: GC content, mappability of sequencing reads, and regional biases that might be generated by local structure. We show that relying on input control as a normalizer is not generally appropriate due to sample to sample variation in bias. To correct sequence bias, we present BEADS (bias elimination algorithm for deep sequencing), a simple three-step normalization scheme that successfully unmasks real binding patterns in ChIP-seq data. We suggest that this procedure be done routinely prior to data interpretation and downstream analyses.


Figures

Figure 1.
Figure 1.
DNA fragments in high-throughput sequencing data are not uniformly distributed over the genome. (a) The patterns of raw sequencing signals of independent C. elegans input sequence extracts and genomic DNA samples (black) are similar to underlying GC content (red) and mappability (blue). Positions 11 075 000–11 098 000 of chromosome I of the C. elegans genome are shown. (b) GC frequency distributions of the C. elegans genome (solid line) and a set of input sequence reads (dashed line). (c) GC frequency ratio between input sequence data and the C. elegans genome.
Figure 2.
Figure 2.
Bias in GC content (a, d, g, j), mappability (b, e, h, k) and raw input sequence signals (c, f, i, l) across internal exons and around transcript start sites in C. elegans and human. The error bars represent the 95% confidence intervals of the estimated mean GC, mappability or sequence signal values.
Figure 3.
Figure 3.
BEADS normalization of high-throughput sequence reads of C. elegans input sequence (a, b), H3K4me3 ChIP (c, d), H3K36me3 ChIP (e, f) and human input sequence (g, h) libraries. Shown are the results following each step of correction: Raw (uncorrected), GC corrected, GC + mappability corrected, and GC + mappability + local corrected signals. Plots show signals across internal exons and around transcript start sites of all genes; except in d and f, only transcript start sites of highly expressed genes were used (see ‘Materials and Methods’ section). The normalized signals are plotted as relative normalized read counts (left-hand y-axis). The fully normalized signal is also plotted as fold-change relative to the genomic average (right-hand y-axis). Solid lines show average signal and shaded regions show 95% confidence intervals. Genomic read-count averages for the C. elegans input-control, H3K4me3, H3K36me3 and human input-control libraries are 33.0, 29.8, 14.6 and 0.4, respectively.

References

    1. Auerbach RK, Euskirchen G, Rozowsky J, Lamarre-Vincent N, Moqtaderi Z, Lefrançois P, Struhl K, Gerstein M, Snyder M. Mapping accessible chromatin regions using Sono-Seq. Proc. Natl Acad. Sci. USA. 2009;106:14926–14931. - PMC - PubMed
    1. Barski A, Cuddapah S, Cui K, Roh T-Y, Schones DE, Wang Z, Wei G, Chepelev I, Zhao K. High-resolution profiling of histone methylations in the human genome. Cell. 2007;129:823–837. - PubMed
    1. Mikkelsen TS, Ku M, Jaffe DB, Issac B, Lieberman E, Giannoukos G, Alvarez P, Brockman W, Kim T-K, Koche RP, et al. Genome-wide maps of chromatin state in pluripotent and lineage-committed cells. Nature. 2007;448:553–560. - PMC - PubMed
    1. Nagalakshmi U, Wang Z, Waern K, Shou C, Raha D, Gerstein M, Snyder M. The transcriptional landscape of the yeast genome defined by RNA sequencing. Science. 2008;320:1344–1349. - PMC - PubMed
    1. Parkhomchuk D, Borodina T, Amstislavskiy V, Banaru M, Hallen L, Krobitsch S, Lehrach H, Soldatov A. Transcriptome analysis by strand-specific sequencing of complementary DNA. Nucleic Acids Res. 2009;37:e123. - PMC - PubMed

Publication types

MeSH terms