. 2011 Jun 13;193(6):1049-64.
doi: 10.1083/jcb.201012035. Epub 2011 Jun 6.

Bub1 overexpression induces aneuploidy and tumor formation through Aurora B kinase hyperactivation

Affiliations

Bub1 overexpression induces aneuploidy and tumor formation through Aurora B kinase hyperactivation

Robin M Ricke et al. J Cell Biol. .

Abstract

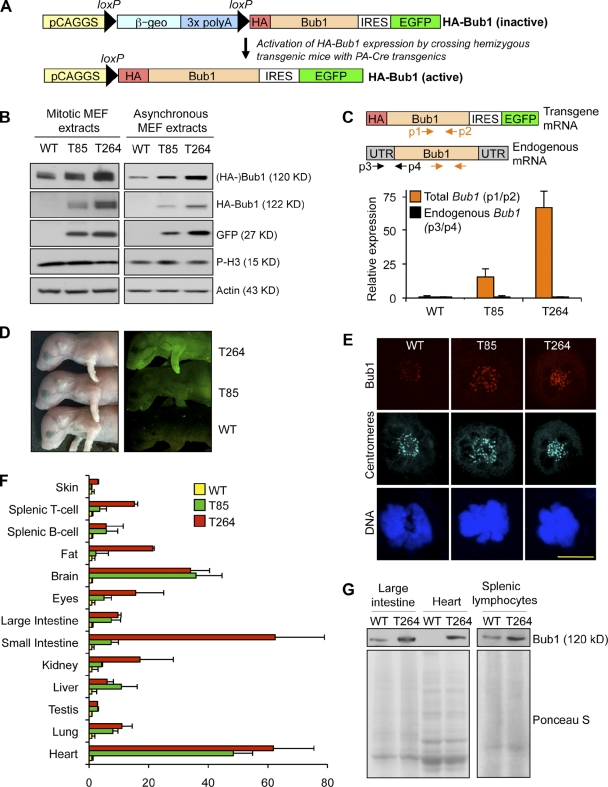
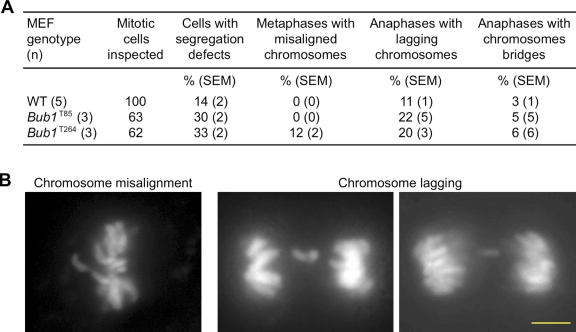
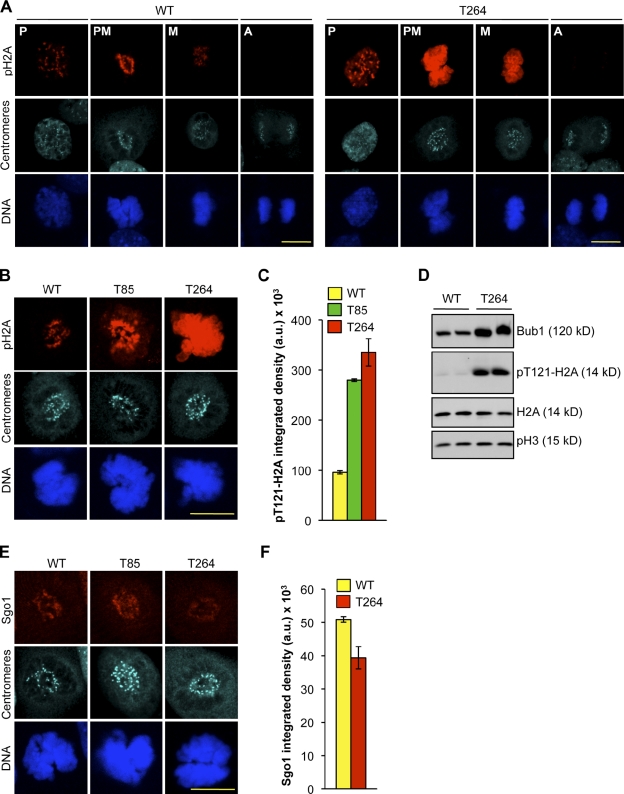
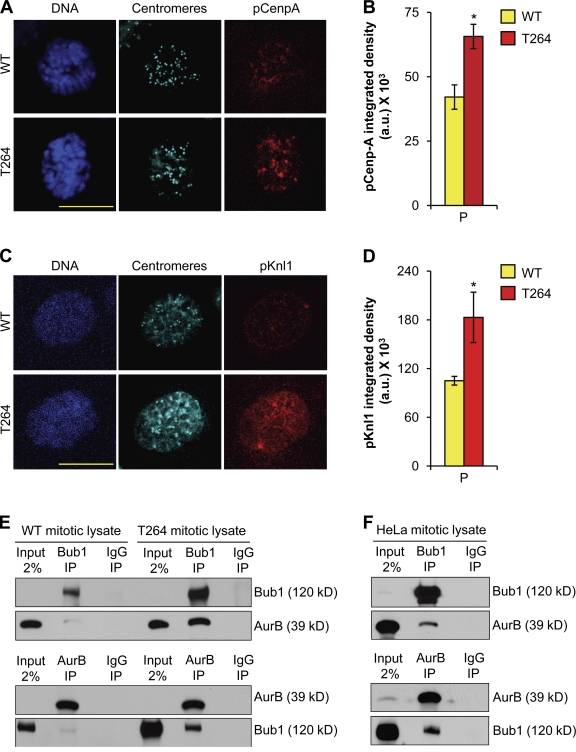
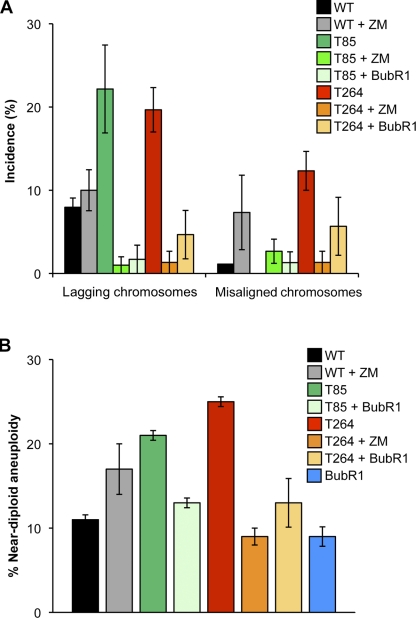
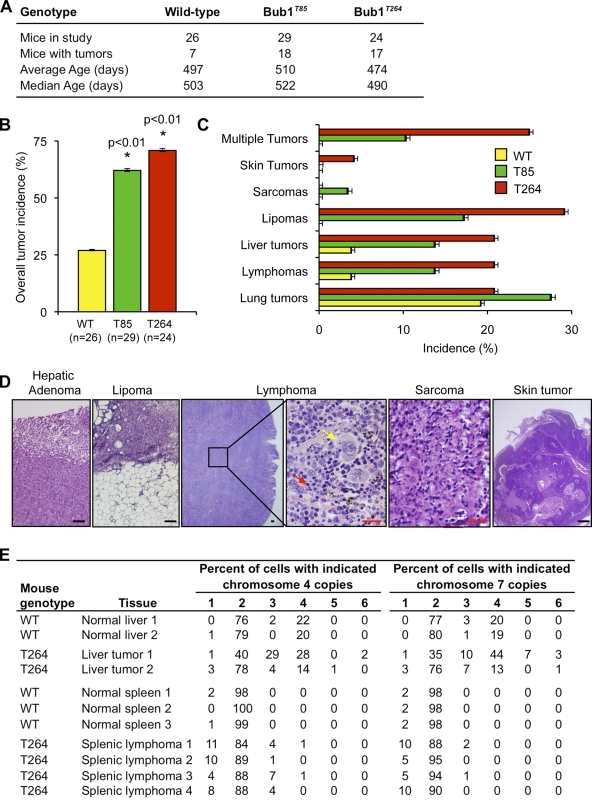
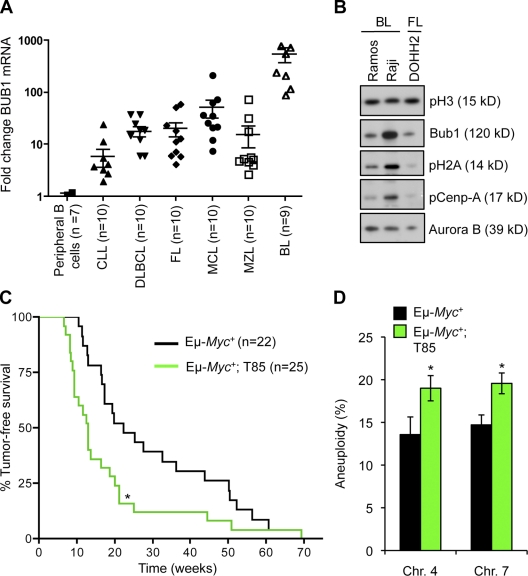
High expression of the protein kinase Bub1 has been observed in a variety of human tumors and often correlates with poor clinical prognosis, but its molecular and cellular consequences and role in tumorigenesis are unknown. Here, we demonstrate that overexpression of Bub1 in mice leads to near-diploid aneuploidies and tumor formation. We found that chromosome misalignment and lagging are the primary mitotic errors responsible for the observed aneuploidization. High Bub1 levels resulted in aberrant Bub1 kinase activity and hyperactivation of Aurora B kinase. When Aurora B activity is suppressed, pharmacologically or via BubR1 overexpression, chromosome segregation errors caused by Bub1 overexpression are largely corrected. Importantly, Bub1 transgenic mice overexpressing Bub1 developed various kinds of spontaneous tumors and showed accelerated Myc-induced lymphomagenesis. Our results establish that Bub1 has oncogenic properties and suggest that Aurora B is a critical target through which overexpressed Bub1 drives aneuploidization and tumorigenesis.


Figures

Figure 1.
Figure 1.
Bub1 transgenic mice overexpress Bub1 protein in a wide variety of tissues and cell types. (A) Overview of the approach used to generate Bub1 transgenic mouse strains. (Top) Transgenic mice were generated in which the HA-Bub1 and EGFP transgenes are inactive due to the presence of a floxed β-geo “STOP” cassette (consisting of β-galactosidase-neomycin fusion gene and three tandemly arranged polyadenylation sites) immediately downstream of the CAGGS promoter. We bred these transgenics to protamine-Cre transgenic mice (O’Gorman et al., 1997) to excise the STOP cassette in the male germline. (Bottom) Breeding of double-transgenic males to wild-type females, yielded offspring in which the CAGGS promoter was juxtaposed with the HA-Bub1 and EGFP coding regions in all cells. IRES, internal ribosomal entry site; PA, protamine. (B) Immunoblot analysis of mitotic and asynchronous lysates from transgenic and wild-type primary MEFs. Blots were probed for endogenous Bub1 (Bub1), exogenous HA-Bub1 (HA), and GFP (GFP). Actin and pH3 were used as loading controls. (C) QRT-PCR for Bub1 transcripts in cycling MEFs of the indicated genotypes. Orange and black arrows mark primer positions for analysis of total (endogenous and exogenous, p1/p2) and endogenous Bub1 (p3/p4), respectively. Data shown are the mean ± SEM (n = 3 independent cell lines, in triplicate). Values were normalized to TBP. (D) EGFP fluorescence from 1-d-old pups of the indicated genotypes. (E) Representative images of wild-type, Bub1T85, and Bub1T264 MEFs in prometaphase coimmunostained with anti-Bub1 and anti-centromere antibodies. DNA was visualized with Hoechst. Bar, 10 µm. (F) Total Bub1 transcripts in various tissues and cell types from mice of the indicated genotypes (primer pair p1/p2 was used in this qRT-PCR analysis). Data shown are the mean ± SEM (n = 3 mice per genotype, in triplicate). Values were normalized to TBP except bone marrow, which was normalized to GAPDH. (G) Western blot analysis of extracts of the indicated tissues and cell types for Bub1. Ponceau S served as a loading control.
Figure 2.
Figure 2.
Bub1 overexpression causes chromosome missegregation. (A) Live-cell imaging analysis of chromosome segregation defects in primary MEFs with indicated genotypes. (B) Representative images of cells with indicated chromosome missegregation events. Bar, 10 µm.
Figure 3.
Figure 3.
Bub1 overexpression results in aberrant Bub1 substrate phosphorylation. (A) Representative images of wild-type and Bub1T264 MEFs at the indicated stages of mitosis that were immunostained for pT121-H2A and centromeres. DNA was visualized with Hoechst. Bar, 10 µm. (B) Representative images of wild-type, Bub1T85, and Bub1T264 prometaphases that were immunostained for pT121-H2A and centromeres. DNA was visualized with Hoechst. Bar, 10 µm. (C) Quantification of pT121-H2A signal of images from B. Data shown are the average of three independent lines and error bars represent SEM. (D) Protein extracts from cycling MEFs of the indicated genotype were blotted and probed for Bub1, pT121-H2A, H2A, and pS10-H3. (E) Representative images of wild-type, Bub1T85, and Bub1T264 prometaphases that were immunostained for centromeres and Sgo1. DNA was visualized with Hoechst. Bar, 10 µm. (F) Quantification of Sgo1 signal of images from E. Data are the average of three independent lines and error bars represent SEM.
Figure 4.
Figure 4.
Aurora B activity is increased in Bub1-overexpressing cells. (A) Representative images of wild-type and Bub1T264 prophase cells immunostained for pCenp-A and centromeres. DNA was visualized with Hoechst. Bar, 10 µm. (B) Quantification of the pCenp-A signal using ImageJ software. Error bars represent SEM. *, P < 0.05 vs. wild type (unpaired t test). (C) Representative images of wild-type and Bub1T264 prophase cells immunostained for pKnl1 and centromeres. DNA was visualized with Hoechst. Bar, 10 µm. (D) Quantification of the pKnl1 signal using ImageJ software. Error bars represent SEM. *, P < 0.05 vs. wild type (unpaired t test). (E) Mitotic extracts of wild-type and Bub1T264 cells subjected to immunoprecipitation with Bub1, Aurora B, or IgG antibodies and analyzed by Western blotting as indicated. (F) Mitotic extracts prepared from taxol-treated HeLa cells subjected to immunoprecipitation with Bub1, Aurora B, or IgG antibodies and analyzed by Western blotting as noted.
Figure 5.
Figure 5.
Aurora B hyperactivation in Bub1-overexpressing cells drives chromosome missegregation and aneuploidization. (A) Chromosome segregation analysis after treatment with 2.5 nM ZM447439 or constitutive co-overexpression of BubR1. The average of three independent primary MEFs is shown. Error bars represent SEM. (B) Chromosome counts on metaphase spreads of P5 wild-type, Bub1T85, and Bub1T264 MEFs after treatment with 2.5 nM ZM447439 or constitutive co-overexpression of BubR1. The average of three independent lines is shown and error bars represent SEM.
Figure 6.
Figure 6.
Bub1 overexpression promotes spontaneous tumorigenesis. (A) Mouse cohort information. Mice were sacrificed between 12 and 16 mo: the average age of the sacrificed animals is indicated per genotype. (B) Spontaneous tumor incidence of mice of the indicated genotypes. *, P < 0.01 vs. wild-type mice using Fisher’s exact test. Error bars indicate 95% confidence interval. (C) Tumor spectrum of mice of the indicated genotypes. Error bars indicate 95% confidence interval. (D) Histological analysis of selected spontaneous tumors from transgenic mice. Black bar, 100 µm. Red bar, 25 µm. Yellow arrow, neoplastic cell; red arrow, normal cell. (E) Interphase FISH for chromosomes 4 and 7 on single cell suspensions of tumors from Bub1 transgenic mice. Normal tissues from age-matched wild-type mice were used as controls.
Figure 7.
Figure 7.
Bub1 overexpression accelerates Myc-mediated lymphomagenesis. (A) Human Bub1 gene transcript was measured from a panel of 59 primary human tumors and normal peripheral B cells using qRT-PCR and normalized to TBP. The difference between lymphomas and normal peripheral B cells was statistically significant (P < 0.05) for all groups, except chronic lymphocytic leukemia. (B) Protein extracts from the indicated lymphoma derived cell lines were immunoblotted for Bub1, Aurora B, pCenp-A, pT121-H2A, and pS10-H3. (C) Survival curves for Eμ-Myc and Eμ-Myc/Bub1T85 mice. *, P < 0.05 vs. Eμ-Myc mice (log-rank test). (D) Quantification of chromosome 4 and 7 copies in EµMyc and Eμ-Myc/Bub1T85 B cell lymphoma cells. *, P < 0.05 (unpaired t test) FISH signals of 100 cells were per lymphoma. Seven lymphomas were analyzed per genotype. Error bars represent SEM.

References

    1. Adams R.R., Maiato H., Earnshaw W.C., Carmena M. 2001. Essential roles of Drosophila inner centromere protein (INCENP) and aurora B in histone H3 phosphorylation, metaphase chromosome alignment, kinetochore disjunction, and chromosome segregation. J. Cell Biol. 153:865–880 10.1083/jcb.153.4.865 - DOI - PMC - PubMed
    1. Agarwal M.L., Agarwal A., Taylor W.R., Wang Z.Q., Wagner E.F., Stark G.R. 1997. Defective induction but normal activation and function of p53 in mouse cells lacking poly-ADP-ribose polymerase. Oncogene. 15:1035–1041 10.1038/sj.onc.1201274 - DOI - PubMed
    1. Alizadeh A.A., Eisen M.B., Davis R.E., Ma C., Lossos I.S., Rosenwald A., Boldrick J.C., Sabet H., Tran T., Yu X., et al. 2000. Distinct types of diffuse large B-cell lymphoma identified by gene expression profiling. Nature. 403:503–511 10.1038/35000501 - DOI - PubMed
    1. Andrews P.D., Ovechkina Y., Morrice N., Wagenbach M., Duncan K., Wordeman L., Swedlow J.R. 2004. Aurora B regulates MCAK at the mitotic centromere. Dev. Cell. 6:253–268 10.1016/S1534-5807(04)00025-5 - DOI - PubMed
    1. Babu J.R., Jeganathan K.B., Baker D.J., Wu X., Kang-Decker N., van Deursen J.M. 2003. Rae1 is an essential mitotic checkpoint regulator that cooperates with Bub3 to prevent chromosome missegregation. J. Cell Biol. 160:341–353 10.1083/jcb.200211048 - DOI - PMC - PubMed

Publication types