. 2011 Jun 13;193(6):1083-99.
doi: 10.1083/jcb.201012179. Epub 2011 Jun 6.

SLAIN2 links microtubule plus end-tracking proteins and controls microtubule growth in interphase

Affiliations

SLAIN2 links microtubule plus end-tracking proteins and controls microtubule growth in interphase

Babet van der Vaart et al. J Cell Biol. .

Abstract

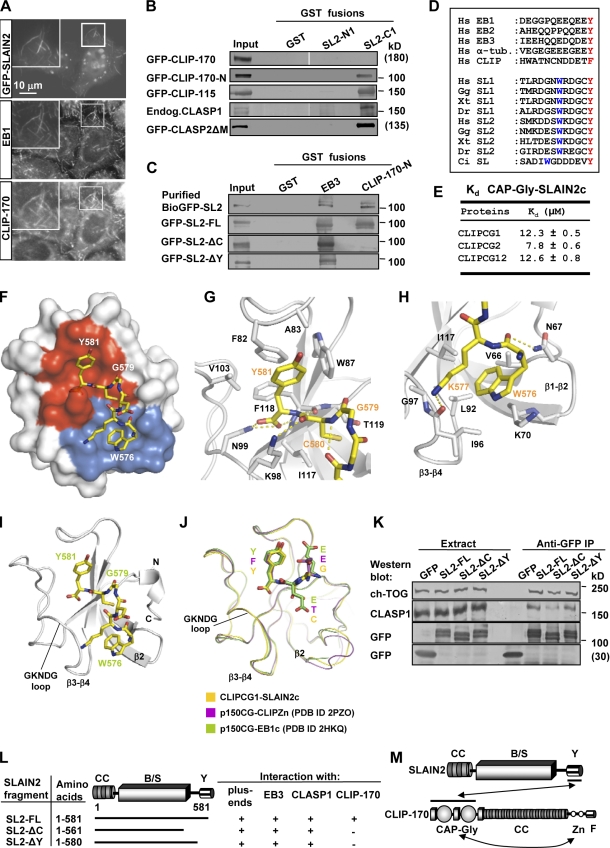
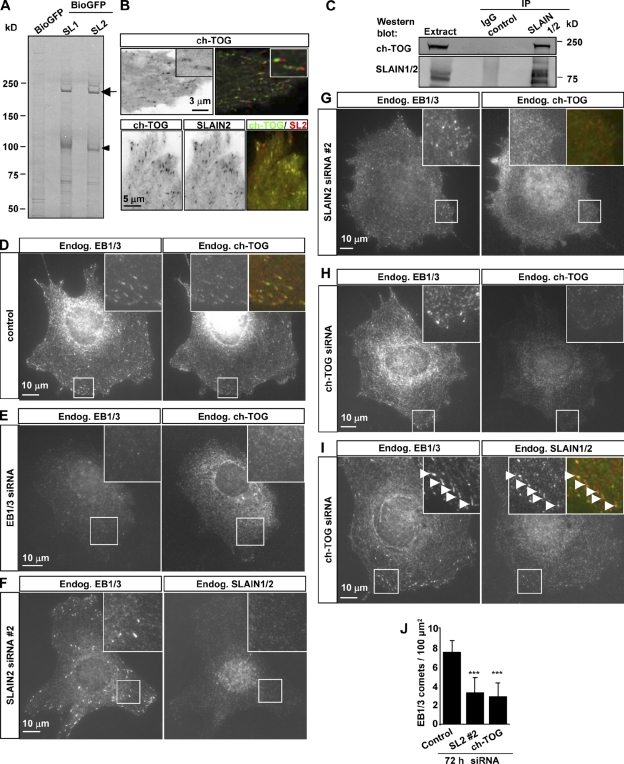
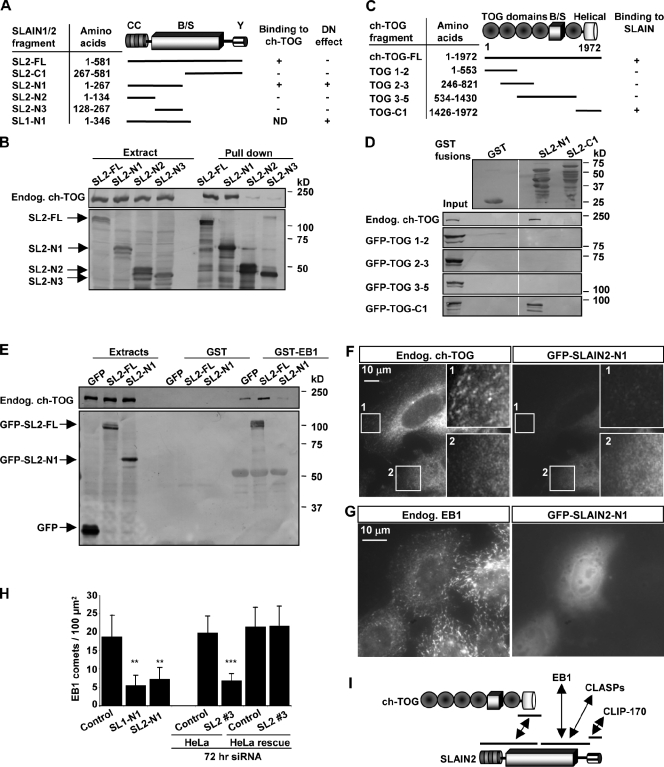
The ends of growing microtubules (MTs) accumulate a set of diverse factors known as MT plus end-tracking proteins (+TIPs), which control microtubule dynamics and organization. In this paper, we identify SLAIN2 as a key component of +TIP interaction networks. We showed that the C-terminal part of SLAIN2 bound to end-binding proteins (EBs), cytoplasmic linker proteins (CLIPs), and CLIP-associated proteins and characterized in detail the interaction of SLAIN2 with EB1 and CLIP-170. Furthermore, we found that the N-terminal part of SLAIN2 interacted with ch-TOG, the mammalian homologue of the MT polymerase XMAP215. Through its multiple interactions, SLAIN2 enhanced ch-TOG accumulation at MT plus ends and, as a consequence, strongly stimulated processive MT polymerization in interphase cells. Depletion or disruption of the SLAIN2-ch-TOG complex led to disorganization of the radial MT array. During mitosis, SLAIN2 became highly phosphorylated, and its interaction with EBs and ch-TOG was inhibited. Our study provides new insights into the molecular mechanisms underlying cell cycle-specific regulation of MT polymerization and the organization of the MT network.


Figures

Figure 1.
Figure 1.
SLAIN1 and SLAIN2 are EB-dependent +TIPs. (A and C) GST pull-down assays were performed with the indicated GST fusions and lysates of cells expressing different GFP-SLAIN1/2 fusions. Coomassie-stained gels are shown for GST fusions, and Western blots with anti-GFP antibodies are shown for GFP fusions. (B) Mapping of the minimal MT plus end–binding domain of SLAIN2 based on GST-EB1 binding and MT plus end tracking in live cells. CC, coiled coil; B/S, basic and serine rich; Y, C-terminal tyrosine. Asterisks indicate SxIP-like motifs. Mutations in the SxIP-like sites are indicated by red asterisks (see Fig. S1 C for the sequence of SLAIN2). (D) Live-cell imaging of HeLa cells transiently transfected with EB3–monomeric RFP and GFP-SLAIN1/2. Red and green images were collected simultaneously with a beam splitter and a 0.5-s interval; five consecutive frames were averaged. (E) IPs from HeLa cell extracts with rat monoclonal antibodies against HA tag (control) or EB1 and EB3 were analyzed by Western blotting with the indicated antibodies. White lines indicate that intervening lanes have been spliced out. (F and H) 3T3 cells were transfected with the indicated siRNAs, fixed, and stained with the indicated antibodies. The insets show enlargements of the boxed areas. In the overlay, EB1 is shown in green, and SLAIN2 is shown in red. (G) Extracts of 3T3 cells transfected with the indicated siRNAs analyzed by Western blotting with the indicated antibodies. Endog., endogenous; SL2, SLAIN2; WB, Western blot.
Figure 2.
Figure 2.
SLAIN2 interacts with CLIPs and CLASPs. (A) HeLa cells were transiently transfected with GFP-SLAIN2, fixed, and labeled with the indicated antibodies. Insets show enlargements of the boxed areas. (B and C) GST pull-down assays were performed with the indicated GST fusions and lysates of untransfected HeLa cells or cells expressing the indicated GFP fusions (SLAIN2 is abbreviated as SL2). Western blots were performed using the antibodies against GFP or CLASP1. The top lane of C shows a GST pull-down assay with BioGFP-SLAIN2 purified from HEK293 cells. White lines indicate that intervening lanes have been spliced out. (D) Alignment of the C-terminal tails of human EB1, EB2, EB3, α-tubulin (α-tub.), CLIP-170, and SLAIN1 and SLAIN2 from different species. Hs, Homo sapiens; Gg, Gallus gallus; Xt, Xenopus tropicalis; Dr, Danio rerio; Ci, Ciona intestinalis. The conserved C-terminal aromatic and the tryptophan residues are highlighted. (E) Equilibrium dissociation constants obtained by ITC for the complexes of the human SLAIN2 peptide (SLAIN2c) with either the first (CLIPCG1), second (CLIPCG2), or both (CLIPCG12) CAP-Gly domains of CLIP-170. (F) Overall view of the heterodimeric complex formed between CLIPCG1 (surface representation) and SLAIN2c (sticks representation). Contact modes A and B are shown in red and blue, respectively. (G and H) Close up views of the interaction network seen in the complex formed between SLAIN2c (yellow carbon atoms) and CLIPCG1 (gray carbon atoms) in the cartoon (main chain) and sticks (contacting residues) representation. Panels G and H depict contact modes A and B, respectively. (I and J) Overall view of the heterodimeric complex formed between CLIPCG1 (ribbon representation) and SLAIN2c (sticks representation; I) and superposition of complexes formed between CAP-Gly domains and C-terminal tyrosine or phenylalanine-containing sequence regions (J). For simplicity, only the last three C-terminal residues of the respective CAP-Gly ligands are shown in sticks representation. (K) IP with anti-GFP antibodies from extracts of HeLa cells expressing GFP or GFP-SLAIN2 fusions were analyzed by Western blotting with the indicated antibodies. (L) Mapping of the SLAIN2 interaction site with CLIP-170, EB3, CLASP1, and MT plus ends. (M) Schematic overview of the SLAIN2–CLIP-170 interaction. CC, coiled-coil; B/S, basic and serine rich; Y, C-terminal tyrosine; Zn, zinc knuckles; F, C-terminal phenylalanine; Endog., endogenous; PDB, Protein Data Bank.
Figure 3.
Figure 3.
SLAIN2 interacts with ch-TOG and promotes its MT plus end accumulation. (A) Streptavidin pull-down assay from HeLa cells expressing BioGFP or BioGFP-SLAIN1 (SL1) or -SLAIN2 (SL2) together with BirA. Proteins were analyzed by Coomassie staining. The arrow indicates ch-TOG, and the arrowhead indicates BioGFP-SLAIN1/2. (B) Live imaging of HeLa cells transiently expressing GFP–ch-TOG alone (top) or in combination with mCherry-SLAIN2 (bottom) collected as described for Fig. 1 D. The top right image shows maximum intensity projection of two consecutive averaged frames displayed in green and red. Insets show enlarged views of individual MT plus ends. (C) IPs from HeLa cell extracts with either the IgG control or SLAIN1/2 antibody were analyzed by Western blotting with the indicated antibodies. (D–I) 3T3 cells were transiently transfected with different siRNAs, fixed, and stained with the indicated antibodies. The insets show enlargements of the boxed areas. Arrowheads in I indicate MT plus ends. In the overlay in D, G, and I, EB1/3 is in red, and ch-TOG or SLAIN1/2 is in green. (J) Quantification of the number of EB1/3-positive comets per 100-µm2 surface area in control 3T3 cells or cells depleted of SLAIN2 or ch-TOG (11–14 cells were analyzed for each condition). Error bars show SD. Values significantly different from control are indicated with asterisks; ***, P < 0.001. Endog., endogenous.
Figure 4.
Figure 4.
SLAIN2 links ch-TOG to EB1. (A) Mapping of the ch-TOG–binding domain of SLAIN1 and 2 (SL1 and SL2). CC, coiled coil; B/S, basic and serine rich; Y, C-terminal tyrosine. The ability to exert a dominant-negative (DN) effect on the number of EB1-positive MT tips is indicated. (B) Streptavidin pull-down assays were performed with extracts of HEK293 cells coexpressing BioGFP-SLAIN2 mutants and BirA and analyzed by Western blotting with the indicated antibodies. (C) Mapping of the SLAIN2-binding domain of ch-TOG. (D and E) GST pull-down assays were performed with the indicated GST fusions and lysates of HEK293 cells expressing GFP fusions of ch-TOG or SLAIN2. Coomassie-stained SDS-PAGE is shown for GST fusions. Western blots with anti-GFP antibodies are shown for GFP fusions and with ch-TOG antibodies for endogenous (Endog.) ch-TOG. White lines indicate that intervening lanes have been spliced out. (F and G) 3T3 (F) or HeLa cells (G) were transfected with GFP–SLAIN2-N1, fixed, and labeled with the indicated antibodies. In F, the insets show enlargements of the boxed areas where 1 is an untransfected control cell and 2 is a GFP–SLAIN2-N1–transfected cell. (H) Quantification of the number of EB1-positive comets per 100-µm2 surface area in control or GFP–SLAIN1/2-N1–expressing HeLa cells. Approximately 10–50 cells were analyzed in each experiment. Error bars show SD. Statistically significant differences are indicated (**, P < 0.01; ***, P < 0.001). (I) A scheme of the identified interactions between SLAIN2, ch-TOG, EB1, CLASPs, and CLIP-170.
Figure 5.
Figure 5.
SLAIN2 and ch-TOG promote MT growth. (A) HeLa cells stably expressing GFP– or mCherry–α-tubulin were transfected with the indicated siRNAs. FRAP assay was performed 72 h later in an internal part of the lamella indicated by a stippled line. Video frames at 33 s after FRAP are shown. Newly polymerized MTs are indicated by arrows. (B) Share of freshly polymerized MT segments longer than 2 µm 30 s after FRAP. Approximately 230–300 growth episodes were analyzed in 15–20 cells for each condition. (C and D) Mean MT elongation rate was measured in internal cytoplasm over periods of 10–50 s from the moment of appearance of the growing MT end until the end of the video or until a catastrophe leading to a processive MT-shortening episode with the length of >1 µm. Analysis was performed in HeLa cells stably expressing EB3-GFP that were transfected with the indicated siRNAs (C) or in HeLa cells stably expressing mCherry–α-tubulin transfected with GFP or GFP–SLAIN1/2-N1 (D). Approximately 70–100 growth episodes in 10–20 cells were analyzed for each condition. (E) Kymographs illustrating MT growth using mCherry–α-tubulin or EB3-GFP after different siRNA treatments or in cells expressing GFP alone (control) or GFP–SLAIN1/2-N1. (F) CHO cells were transiently transfected with EB3-GFP and the indicated shRNAs. Live images were collected with a 0.5-s time interval. Single frames (top) and maximum intensity projections of 100 frames (bottom) are shown. (G) Length of EB3-GFP comets in control, SLAIN2, or ch-TOG–depleted cells determined from live imaging experiments shown in F. Approximately 300 MT tips were analyzed in ∼15 cells per condition. (H and I) Proportion of MT tracks originating from the centrosome with the length exceeding 7.5 µm (H) and MT nucleation frequency from the centrosome in CHO cells transiently transfected with EB3-GFP and the indicated shRNAs (I). In H, ∼100 MT growth episodes were analyzed in ∼15 cells per condition. In I, ∼10 cells were analyzed per condition. (J and K) MT recovery after nocodazole washout. HeLa cells expressing GFP or GFP–SLAIN1/2-N1 for 1 d were treated with 10 µm nocodazole for 2 h. The drug was washed out with fresh medium, and cells were fixed and stained 10 min later (J). The number of MTs per 100 µm2 was counted in 20 cells for each condition (K). (L and M) MT organization in HeLa cells transiently expressing GFP or GFP–SLAIN1/2-N1 1 d after transfection. Cells were stained for β-tubulin (L), and the angles of MT segments in relation to the long axis of the lamella were measured. Angle distributions measured in 10 cells and their Gaussian fits are shown for each condition (M). Transfected cells are indicated by asterisks in J and L. In C, D, G–I, and K, the values significantly different from controls are indicated with asterisks (**, P < 0.01; ***, P < 0.001).
Figure 6.
Figure 6.
Mitotic phosphorylation disrupts SLAIN2 interaction with MTs, EB1, and ch-TOG. (A) Proportion of mitotic HeLa cells identified by staining with antibodies against histone H3 phosphorylated at serine 10 after transfection with the indicated siRNAs. (B) HeLa cells stably expressing GFP-SLAIN2 (SL2) were fixed and stained with anti-EB1 antibodies. The prophase cell was distinguished by the strong increase in centrosomal MT nucleation. Insets show enlargements of the boxed areas. (C) IPs with anti-SLAIN1/2 antibodies from control HeLa cells or cells blocked in mitosis with 0.1 µM nocodazole. Where indicated, immunoprecipitated material was treated on beads with λ phosphatase. Western blotting was performed with the indicated antibodies. (D) The same experiment as in C but using a GFP-SLAIN2 stable HeLa cell line and anti-GFP antibodies. (E) GST pull-down assays were performed with GST or GST-EB1, and cell extracts were prepared as in D. (F) The same experiment as in C but using HeLa cells transiently expressing N- and C-terminal fragments of SLAIN2. (G and H) HeLa cells stably expressing GFP-SLAIN2 were blocked in mitosis with 7.5 µM STLC (G) or 0.1 µM nocodazole (H) and released for 1 h into medium containing either the indicated inhibitors, 20 mM NaCl, or 20 mM LiCl. White lines indicate that intervening lanes have been spliced out. S, STLC; N, nocodazole; FP, flavopiridol; Endog., endogenous; Cont., control; Mit., mitotic; Extr., extract.
Figure 7.
Figure 7.
A scheme of SLAIN2-linked +TIP network and its biological role. Different types of +TIP interactions are indicated by different colors. The potential direct EB1–ch-TOG interaction based on the data from other species (Rehberg and Gräf, 2002; Wolyniak et al., 2006; Kronja et al., 2009) is not depicted. SLAIN2-dependent interactions enhance ch-TOG accumulation at the MT tip. ch-TOG, in turn, promotes processive MT growth that is required for proper MT organization.

References

    1. Akhmanova A., Steinmetz M.O. 2008. Tracking the ends: a dynamic protein network controls the fate of microtubule tips. Nat. Rev. Mol. Cell Biol. 9:309–322 10.1038/nrm2369 - DOI - PubMed
    1. Akhmanova A., Hoogenraad C.C., Drabek K., Stepanova T., Dortland B., Verkerk T., Vermeulen W., Burgering B.M., De Zeeuw C.I., Grosveld F., Galjart N. 2001. Clasps are CLIP-115 and -170 associating proteins involved in the regional regulation of microtubule dynamics in motile fibroblasts. Cell. 104:923–935 10.1016/S0092-8674(01)00288-4 - DOI - PubMed
    1. Barr A.R., Gergely F. 2008. MCAK-independent functions of ch-Tog/XMAP215 in microtubule plus-end dynamics. Mol. Cell. Biol. 28:7199–7211 10.1128/MCB.01040-08 - DOI - PMC - PubMed
    1. Bonfils C., Bec N., Lacroix B., Harricane M.C., Larroque C. 2007. Kinetic analysis of tubulin assembly in the presence of the microtubule-associated protein TOGp. J. Biol. Chem. 282:5570–5581 10.1074/jbc.M605641200 - DOI - PMC - PubMed
    1. Brouhard G.J., Stear J.H., Noetzel T.L., Al-Bassam J., Kinoshita K., Harrison S.C., Howard J., Hyman A.A. 2008. XMAP215 is a processive microtubule polymerase. Cell. 132:79–88 10.1016/j.cell.2007.11.043 - DOI - PMC - PubMed

Publication types

MeSH terms