. 2011 Aug;31(15):3182-94.
doi: 10.1128/MCB.01433-10. Epub 2011 Jun 6.

miR-29a and miR-29b contribute to pancreatic beta-cell-specific silencing of monocarboxylate transporter 1 (Mct1)

Affiliations

miR-29a and miR-29b contribute to pancreatic beta-cell-specific silencing of monocarboxylate transporter 1 (Mct1)

Timothy J Pullen et al. Mol Cell Biol. 2011 Aug.

Abstract

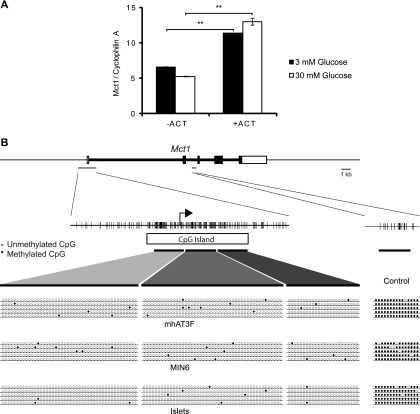
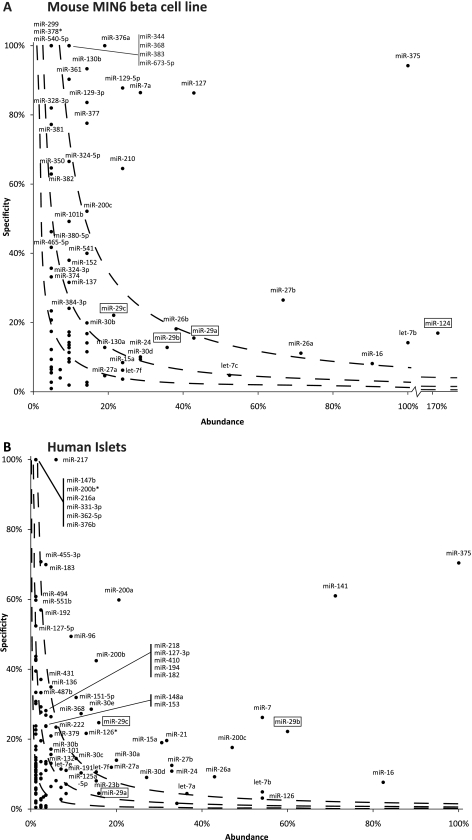
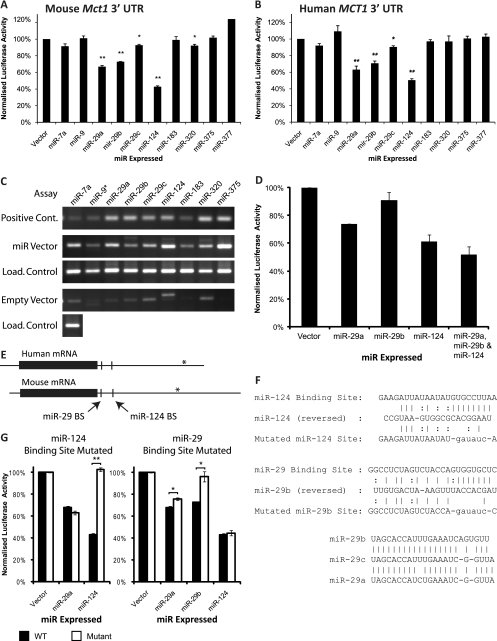
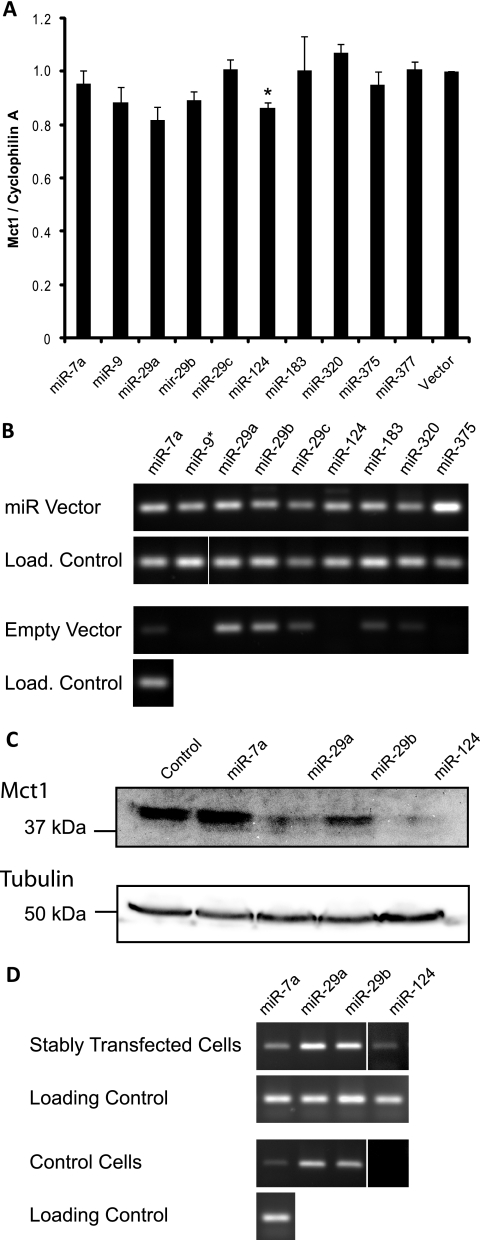
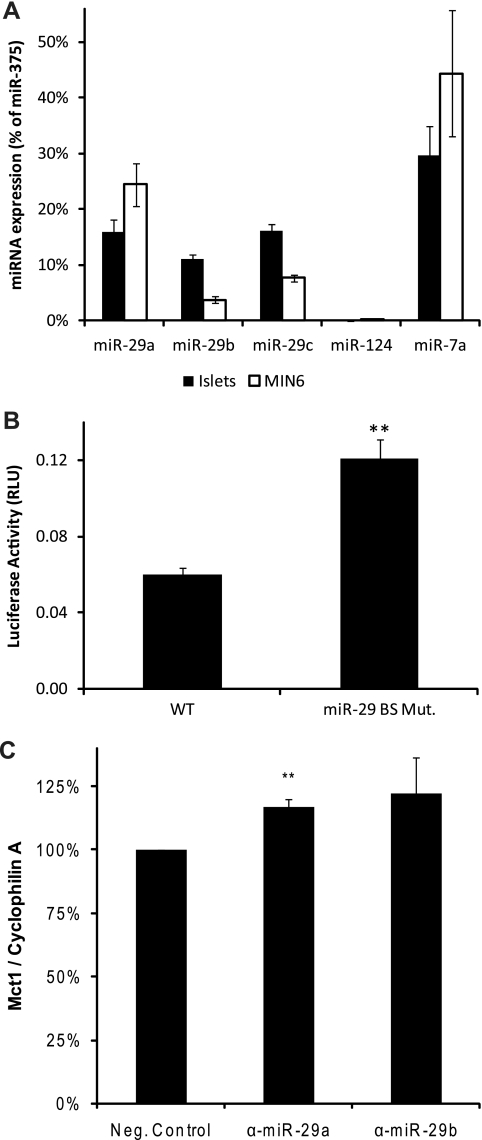
In pancreatic β cells, elevated glucose concentrations stimulate mitochondrial oxidative metabolism to raise intracellular ATP/ADP levels, prompting insulin secretion. Unusually low levels of expression of genes encoding the plasma membrane monocarboxylate transporter, MCT1 (SLC16A1), as well as lactate dehydrogenase A (LDHA) ensure that glucose-derived pyruvate is efficiently metabolized by mitochondria, while exogenous lactate or pyruvate is unable to stimulate metabolism and hence insulin secretion inappropriately. We show here that whereas DNA methylation at the Mct1 promoter is unlikely to be involved in cell-type-specific transcriptional repression, three microRNAs (miRNAs), miR-29a, miR-29b, and miR-124, selectively target both human and mouse MCT1 3' untranslated regions. Mutation of the cognate miR-29 or miR-124 binding sites abolishes the effects of the corresponding miRNAs, demonstrating a direct action of these miRNAs on the MCT1 message. However, despite reports of its expression in the mouse β-cell line MIN6, miR-124 was not detectably expressed in mature mouse islets. In contrast, the three isoforms of miR-29 are highly expressed and enriched in mouse islets. We show that inhibition of miR-29a in primary mouse islets increases Mct1 mRNA levels, demonstrating that miR-29 isoforms contribute to the β-cell-specific silencing of the MCT1 transporter and may thus affect insulin release.


Figures

Fig. 1.
Fig. 1.
The Mct1 promoter is not methylated in pancreatic β or hepatoma cells. (A) Mct1 mRNA quantified relative to cyclophilin A by qRT-PCR from MIN6 cells treated with DNA methylation inhibitor 5-azacytidine (ACT) in 3 or 30 mM glucose. (B) Bisulfite sequencing of the CpG island associated with the Mct1 promoter in the liver cell line mhAT3F, β cell line MIN6, and in isolated pancreatic islets. The arrow marks the transcriptional start site, and individual CpGs are marked with vertical dashes. The thick dark lines represent the regions amplified by PCR for sequencing, with the results from five independent clones for each cell type shown below. Open circles represent unmethylated CpG and closed circles methylated ones. As a positive control for the bisulfite sequencing, an internal region of the Mct1 gene was also analyzed.
Fig. 2.
Fig. 2.
miRNA expression in MIN6 mouse β cells (A) and human islets (B) relative to other tissues. The abundance of miRNAs is presented as the percentage of expression relative to miR-375. Specificity represents that percentage of miRNA found in β cells/islets relative to the total level found across all tissue types of the appropriate species. The miRNAs were ranked according to the combined abundance and specificity scores, and the quartiles of this rank distribution are marked by dashed lines on the graph. miR-29 isoforms and miR-124 are highlighted with boxes.
Fig. 3.
Fig. 3.
Reporter-based assays of the impact of miRNAs targeting the Mct1 3′ UTR in HEK293 cells. Luciferase assays were performed to assess the effect of miRNA overexpression on mouse (A) or human (B) Mct1 3′ UTR. The level of firefly luciferase activity, normalized against Renilla luciferase, is presented as a percentage of signal obtained with an empty miRNA expression vector. (C) Mature miRNAs expressed in samples from a parallel transfection were detected by reverse transcription using stem-loop primers followed by PCR. Assays for each miRNA were performed on samples transfected with the appropriate miRNA expression vector and on an empty vector control. U6 snRNA was assayed in all samples as a loading (load.) control. As a positive control for each miRNA assay, 1 pM synthetic DNA oligonucleotide corresponding to the mature miRNA sequence was assayed in parallel. (D) Luciferase assay of the combined effects of miR-29a, miR-29b, and miR-124 expression on mouse Mct1 3′ UTR. (E) Mct1 mRNA from humans and mice with open reading frames marked with solid boxes. The locations of putative miR-29 and miR-124 binding sites (BS) are also indicated. In both species, cDNAs with shorter 3′ UTRs are reported in databases, and the sites of alternative transcription termination sites are marked with asterisks. (F) Base pair binding between miRNAs and putative miRNA binding sites in the mouse Mct1 3′ UTR. The binding sites were mutated by replacing the 8-bp seed region with a restriction enzyme site. An alignment of the three miR-29 isoforms is also shown. (G) Luciferase assay of mouse Mct1 3′ UTR with the putative miRNA binding sites mutated.
Fig. 4.
Fig. 4.
Effect of miRNA overexpression on endogenous Mct1 in the mhAT3F hepatocyte cell line. (A) The endogenous Mct1 mRNA level in mhAT3F cells was quantified by qRT-PCR following transient transfection with miRNA expression vectors. (B) Overexpression of mature miRNAs was confirmed by RT-PCR with stem-loop primers. Assays for each miRNA were performed on samples transfected with the appropriate miRNA expression vector and also on an empty vector control. U6 snRNA was also assayed in each sample as a loading (Load.) control. (C) mhAT3F cells were stably transfected with miRNA expression vectors or an empty expression vector as a control. Endogenous Mct1 protein detected by Western blotting, and the blot was reprobed for β-tubulin as a loading control. (D) Mature miRNAs were detected by RT-PCR with stem-loop primers in cells stably transfected with miRNA expression vectors relative to the empty vector control. U6 snRNA was assayed in all samples as a loading control. Note that the contrast for lane 4 (miR-124) was enhanced equally in both stably transfected and control cells with respect to lanes 1 to 3 to allow visualization of the band.
Fig. 5.
Fig. 5.
(A) Mature miRNAs expressed in mouse islets and the MIN6 β cell line were measured by qRT-PCR using stem-loop primers. Quantification is presented as a percentage of the miR-375 level to facilitate comparison with Fig. 2. (B) Luciferase assay of endogenous miRNA function in MIN6 β cells. MIN6 cells were transfected with firefly luciferase plasmids containing the mouse Mct1 3′ UTR along with control Renilla luciferase plasmid. Expression from the plasmid containing the wild-type (WT) 3′ UTR was compared with that of mutants in which the miR-29 binding site was disrupted. The increase in expression caused by these mutations indicates the extent to which endogenous levels of miR-29 reduce Mct1 expression. RLU, relative light units. (C) Isolated mouse islets were transfected with LNA miRNA inhibitors, and Mct1 mRNA levels were measured relative to cyclophilin A. α-miR-29 and α-miR-29b, anti-miR-29a and -29b LNAs, respectively.

References

    1. Baroukh N., et al. 2007. MicroRNA-124a regulates Foxa2 expression and intracellular signaling in pancreatic beta-cell lines. J. Biol. Chem. 282:19575–19588 - PubMed
    1. Betel D., Wilson M., Gabow A., Marks D. S., Sander C. 2008. The microRNA.org resource: targets and expression. Nucleic Acids Res. 36:D149–D153 - PMC - PubMed
    1. Bird A. 2002. DNA methylation patterns and epigenetic memory. Genes Dev. 16:6–21 - PubMed
    1. Bock C., et al. 2005. BiQ Analyzer: visualization and quality control for DNA methylation data from bisulfite sequencing. Bioinformatics 21:4067–4068 - PubMed
    1. Bravo-Egana V., et al. 2008. Quantitative differential expression analysis reveals miR-7 as major islet microRNA. Biochem. Biophys. Res. Commun. 366:922–926 - PMC - PubMed

Publication types

MeSH terms

LinkOut - more resources