. 2011 May 27:5:48.
doi: 10.3389/fnhum.2011.00048. eCollection 2011.

Rational decision-making in inhibitory control

Affiliations

Rational decision-making in inhibitory control

Pradeep Shenoy et al. Front Hum Neurosci. .

Abstract

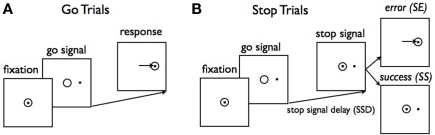
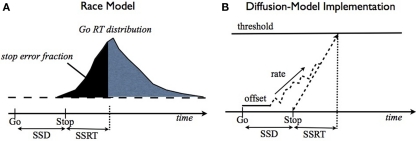
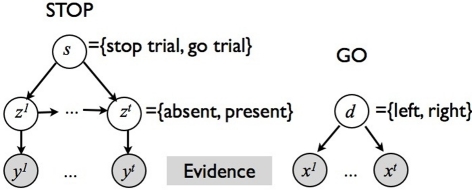
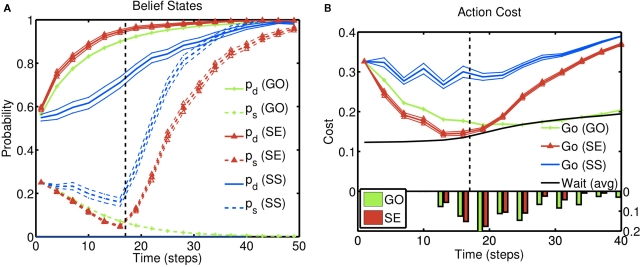
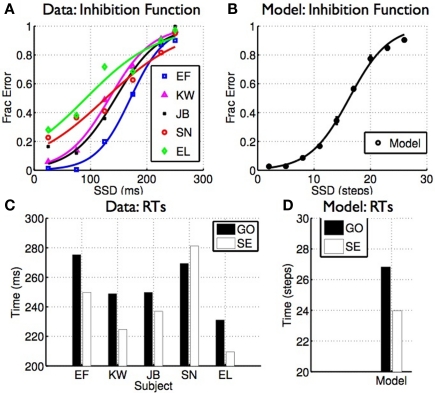
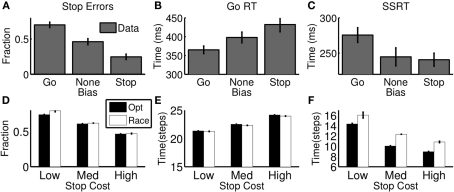
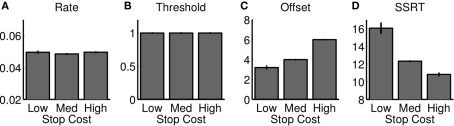
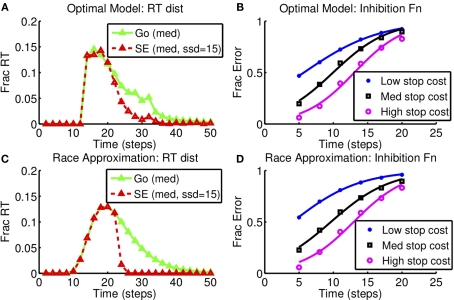
An important aspect of cognitive flexibility is inhibitory control, the ability to dynamically modify or cancel planned actions in response to changes in the sensory environment or task demands. We formulate a probabilistic, rational decision-making framework for inhibitory control in the stop signal paradigm. Our model posits that subjects maintain a Bayes-optimal, continually updated representation of sensory inputs, and repeatedly assess the relative value of stopping and going on a fine temporal scale, in order to make an optimal decision on when and whether to go on each trial. We further posit that they implement this continual evaluation with respect to a global objective function capturing the various reward and penalties associated with different behavioral outcomes, such as speed and accuracy, or the relative costs of stop errors and go errors. We demonstrate that our rational decision-making model naturally gives rise to basic behavioral characteristics consistently observed for this paradigm, as well as more subtle effects due to contextual factors such as reward contingencies or motivational factors. Furthermore, we show that the classical race model can be seen as a computationally simpler, perhaps neurally plausible, approximation to optimal decision-making. This conceptual link allows us to predict how the parameters of the race model, such as the stopping latency, should change with task parameters and individual experiences/ability.

Keywords: inhibitory control; optimal decision-making; speed-accuracy tradeoff; stop signal task.


Figures

Figure 1
Figure 1
Schematic illustration of a saccadic version of the stop signal task. (A) On a majority of trials (go trials), a central fixation dot is followed by one of two targets requiring a saccade to the indicated location. (B) On stop trials, the target presentation is followed after a short delay (SSD) by reappearance of the fixation point. A saccade on a stop trial is a stop error (SE), and a successfully canceled movement is a stop success (SS). Figure adapted from Hanes and Schall (1995).
Figure 2
Figure 2
Race model and drift-diffusion model for the stop signal task. (A) The race model (Logan and Cowan, 1984) proposes that the finishing times of two independent (go and stop) processes determine trial outcome: stop or go, depending on which finishes first. SSD + SSRT (stop signal reaction time) specifies the finishing time of the stop process, and determines what fraction of go trials will finish earlier and therefore result in a stop error. (B) An implementation of the race model using a drift-diffusion process, similar to (Verbruggen and Logan, 2009b). The go process consisting of a constant drift rate corrupted by additive Wiener (Gaussian, white) noise on each time step, a temporal offset (also known as the non-decision time), and a threshold for evoking the go response. The stop process is assumed to initiate at a time SSD after the go stimulus, and to take a time of SSRT (assumed to be fixed here) to reach the threshold. Whichever process finishes first determines trial outcome: go or stop.
Figure 3
Figure 3
Graphical model for sensory input generation in our Bayesian model. Two separate streams of observations, {x1,…,xt,…} and {y1,…,yt,…}, are associated with the go and stop stimuli, respectively. xt depend on the identity of the target, d∈{0,1}. yt depends on whether the current trial is a stop trial, s = {0,1}, and whether the stop signal has already appeared by time t,zt∈{0,1}.
Figure 4
Figure 4
Inference and action selection in the stop signal task. (A) Evolution of the belief state over time, on go trials (green), successful stop trials (SS; blue), and error stop trials (SE; red). Solid lines represent the posterior probabilities assigned to the true identity of the go stimulus (one of two possibilities) for the three types of trials – they all rise steadily toward the value 1, as sensory evidence accumulates. The dashed black vertical line represents the onset of the stop signal on stop trials. The probability of a stop signal being present (dashed lines) rises initially in a manner dependent upon prior expectations of frequency and timing of the stop signal, and subsequently rises farther toward the value 1 (stop trials), or drops to 0 (go trials), based on sensory evidence. (B) Average action costs corresponding to going (Qgt,see text) and waiting (Qwt, see text), using the same sets of trials as (A). The black dashed vertical line denotes the onset of the stop signal. A response is initiated when the cost of going drops below the cost of waiting. The RT histograms for go and error stop trials (bottom) indicate the temporal distribution of when the go cost crosses the stop cost in each simulated trial. Each data point is an average of 10,000 simulated trials. Error bar = SEM. Simulation parameters: qd = 0.68, qs = 0.72, λ = 0.2, r = 0.25, D = 50, cs = 0.2, cs = 0.004. See section 2 for definition of parameters. Unless otherwise specified, these parameters were used in all subsequent simulations.
Figure 5
Figure 5
Classical properties of stopping behavior arise naturally from optimal decision-making. (A) Inhibition function: errors on stop trials increase as a function of SSD. (B) Similar inhibition function seen for the model. (C) Discrimination RT is generally faster on stop error trials than go trials. (D) Similar results seen in the model. (A,C) Data adapted from Emeric et al. (2007)with permission from Elsevier.
Figure 6
Figure 6
Effect of reward manipulation on stopping behavior. (A–C) Data from human subjects performing a variant of the stop signal task where the ratio of rewards for quick go responses and successful stopping was varied, inducing a bias toward going or stopping (adapted from Leotti and Wager, with permission from APA). As stop errors are punished more severely, subjects have lower stop error rate (A), slower go RT (B), and faster SSRT (C); low stop error penalty induces the opposite pattern. (D–F) The optimal decision model (black) and its best-fitting race model approximation (white) show similar trends as a function of stop error penalty (relative to go errors). “High,” “Med,” “Low” refer to high (cs = 0.5, medium (cs = 0.25), and low (cs = 0.15) stop error penalty, respectively. For model simulations (D-F), each bar denotes average of 10 simulated “sessions,” each session consisting of 10,000 trials. Error bar = SEM.
Figure 7
Figure 7
Race model approximation to optimal decision-making as stop error penalty is varied. The figure shows the best race parameters, implemented as a diffusion model shown in Figure 2, that approximate the behavior of the optimal model, as the cost of stop errors is changed. The temporal offset to the start of the diffusion process increases (C), and SSRT decreases (D); rate and threshold parameters are unaffected (A, B). Changes in SSRT are similar to those in optimal model and experimental data (Figure 5). Each bar denotes average of 10 simulated “sessions,” each session consisting of 10,000 trials. Error bar = SEM.
Figure 8
Figure 8
Race model approximation to optimal decision-making as stop error penalty is varied: inhibition function and RT distribution. (A,B) Optimal model. (C,D) Diffusion race model. Left: RT distributions for GO and SE trials. SSD = 15, cs = 0.25, as in Figure 6. Right: Inhibition function for different stop error costs (low: cs = 0.15, med: cs = 0.25, high: cs = 0.5). Results based on 10,000 simulated trials from the optimal model, and also from the corresponding best-fitting diffusion race model.

References

    1. Alcock J., Sherman P. (1994). The utility of the proximate-ultimate dichotomy in ethology. Ethology 96, 58–62 10.1111/j.1439-0310.1994.tb00881.x - DOI
    1. Alderson R., Rapport M., Kofler M. (2007). Attention-deficit/hyperactivity disorder and behavioral inhibition: a meta-analytic review of the stop-signal paradigm. J. Abnorm. Child Psychol. 35, 745–758 - PubMed
    1. Amieva H., Lafont S., Auriacombe S., Le Carret N., Dartigues J. F., Orgogozo J. M., Fabrigoule C. (2002). Inhibitory breakdown and dementia of the Alzheimer type: a general phenomenon? J. Clin. Exp. Neuropsychol. 24, 503–516 - PubMed
    1. Aron A., Behrens T., Smith S., Frank M., Poldrack R. (2007a). Triangulating a cognitive control network using diffusion-weighted magnetic resonance imaging (MRI) and functional MRI. J. Neurosci. 27, 3743. 10.1523/JNEUROSCI.0519-07.2007 - DOI - PMC - PubMed
    1. Aron A., Durston S., Eagle D., Logan G., Stinear C., Stuphorn V. (2007b). Converging evidence for a fronto-basal-ganglia network for inhibitory control of action and cognition. J. Neurosci. 27, 11860. 10.1523/JNEUROSCI.3644-07.2007 - DOI - PMC - PubMed

LinkOut - more resources