

Trends over 5 decades in U.S. occupation-related physical activity and their associations with obesity
- PMID: 21647427
- PMCID: PMC3102055
- DOI: 10.1371/journal.pone.0019657
Trends over 5 decades in U.S. occupation-related physical activity and their associations with obesity
Abstract
Background: The true causes of the obesity epidemic are not well understood and there are few longitudinal population-based data published examining this issue. The objective of this analysis was to examine trends in occupational physical activity during the past 5 decades and explore how these trends relate to concurrent changes in body weight in the U.S.
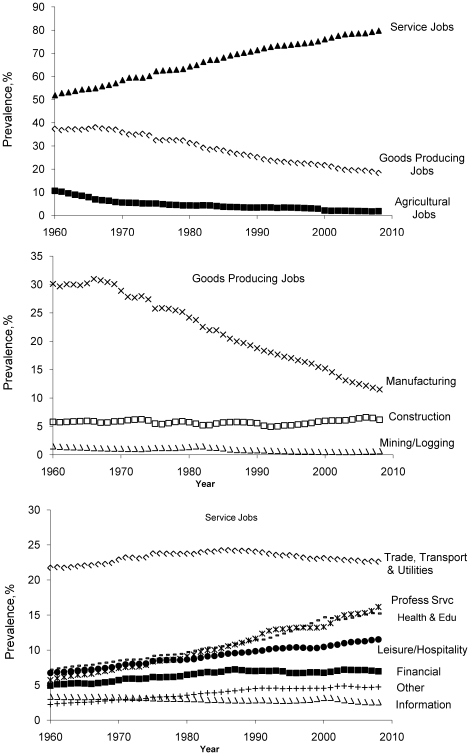
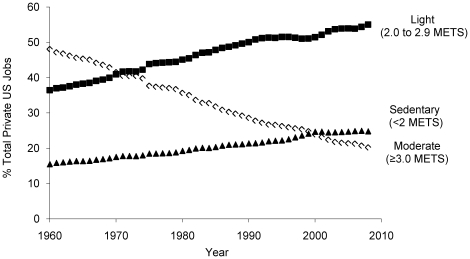
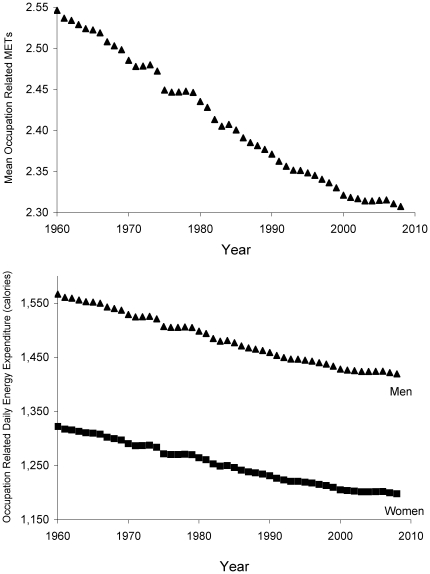
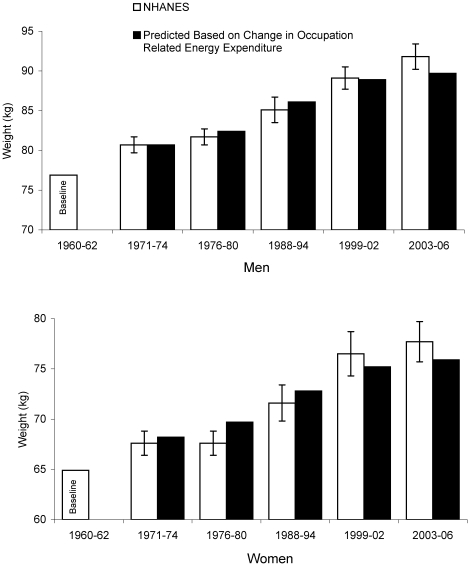
Methodology/principal findings: Analysis of energy expenditure for occupations in U.S. private industry since 1960 using data from the U.S. Bureau of Labor Statistics. Mean body weight was derived from the U.S. National Health and Nutrition Examination Surveys (NHANES). In the early 1960's almost half the jobs in private industry in the U.S. required at least moderate intensity physical activity whereas now less than 20% demand this level of energy expenditure. Since 1960 the estimated mean daily energy expenditure due to work related physical activity has dropped by more than 100 calories in both women and men. Energy balance model predicted weights based on change in occupation-related daily energy expenditure since 1960 for each NHANES examination period closely matched the actual change in weight for 40-50 year old men and women. For example from 1960-62 to 2003-06 we estimated that the occupation-related daily energy expenditure decreased by 142 calories in men. Given a baseline weight of 76.9 kg in 1960-02, we estimated that a 142 calories reduction would result in an increase in mean weight to 89.7 kg, which closely matched the mean NHANES weight of 91.8 kg in 2003-06. The results were similar for women.
Conclusion: Over the last 50 years in the U.S. we estimate that daily occupation-related energy expenditure has decreased by more than 100 calories, and this reduction in energy expenditure accounts for a significant portion of the increase in mean U.S. body weights for women and men.
Conflict of interest statement
Figures
References
-
- Flegal KM, Carroll MD, Ogden CL, Curtin LR. Prevalence and trends in obesity among US adults, 1999–2008. JAMA. 2010;303:235–241. - PubMed
-
- Flegal KM, Graubard BI, Williamson DF, Gail MH. Excess deaths associated with underweight, overweight, and obesity. JAMA. 2005;293:1861–1867. - PubMed
-
- Katan MB, Ludwig DS. Extra calories cause weight gain–but how much? JAMA. 2010;303:65–66. - PubMed
-
- Swinburn B, Sacks G, Ravussin E. Increased food energy supply is more than sufficient to explain the US epidemic of obesity. Am J Clin Nutr. 2009;90:1453–1456. - PubMed
MeSH terms
LinkOut - more resources
Full Text Sources
Medical
Miscellaneous
