

Skin barrier homeostasis in atopic dermatitis: feedback regulation of kallikrein activity
- PMID: 21647431
- PMCID: PMC3102059
- DOI: 10.1371/journal.pone.0019895
Skin barrier homeostasis in atopic dermatitis: feedback regulation of kallikrein activity
Abstract
Atopic dermatitis (AD) is a widely spread cutaneous chronic disease characterised by sensitive reactions (eg. eczema) to normally innocuous elements. Although relatively little is understood about its underlying mechanisms due to its complexity, skin barrier dysfunction has been recognised as a key factor in the development of AD. Skin barrier homeostasis requires tight control of the activity of proteases, called kallikreins (KLKs), whose activity is regulated by a complex network of protein interactions that remains poorly understood despite its pathological importance. Characteristic symptoms of AD include the outbreak of inflammation triggered by external (eg. mechanical and chemical) stimulus and the persistence and aggravation of inflammation even if the initial stimulus disappears. These characteristic symptoms, together with some experimental data, suggest the presence of positive feedback regulation for KLK activity by inflammatory signals. We developed simple mathematical models for the KLK activation system to study the effects of feedback loops and carried out bifurcation analysis to investigate the model behaviours corresponding to inflammation caused by external stimulus. The model analysis confirmed that the hypothesised core model mechanisms capture the essence of inflammation outbreak by a defective skin barrier. Our models predicted the outbreaks of inflammation at weaker stimulus and its longer persistence in AD patients compared to healthy control. We also proposed a novel quantitative indicator for inflammation level by applying principal component analysis to microarray data. The model analysis reproduced qualitative AD characteristics revealed by this indicator. Our results strongly implicate the presence and importance of feedback mechanisms in KLK activity regulation. We further proposed future experiments that may provide informative data to enhance the system-level understanding on the regulatory mechanisms of skin barrier in AD and healthy individuals.
Conflict of interest statement
Figures
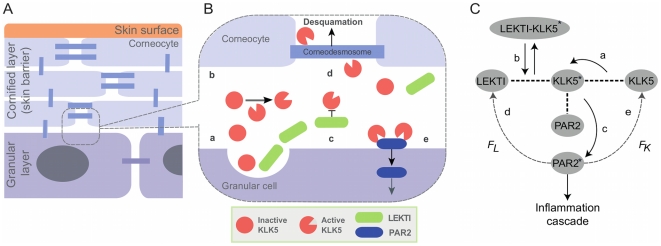
 ); (e) Feedback from PAR2* to production of KLK5 (
 ); Inflammation level is denoted by the level of PAR2*.
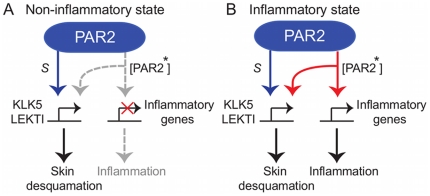
 , is constitutively produced, maintaining the basal activity of KLK5 production for the normal desquamation process. Various external stimuli can influence
  to be fluctuated around its nominal value. B: For the inflammatory states, a large amount of activated PAR2, [PAR2*], is induced and internalized, which then transduce stronger canonical signalling cascades and increase the expression of inflammatory genes including IL1
 , IL1
, IL1
 , IL8 and TNF-
 .
.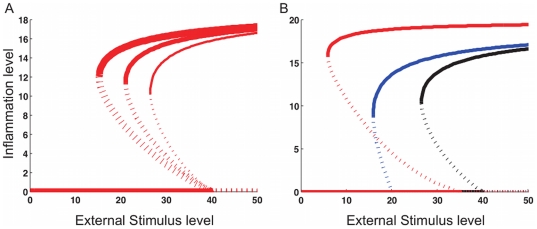
 . Stronger positive feedback leads to more persistent inflammation, as is shown by the larger range of the bistability. B: The behaviours are compared for HC (black), AD-LEKTI (blue), and AD-pH (red) with
  and
and  . The inflammation threshold is lower for AD conditions than that for HC.
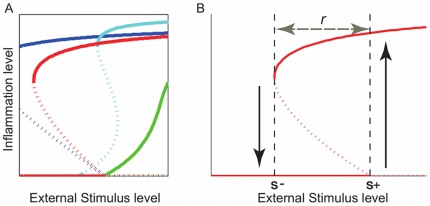
 and persists until
  decreases to reach the deactivation threshold
  , where the inflammation level returns to zero. The range of bistability
  represents the required level of decrease in the external stimulus for the inflammation to cease. Smaller values of
  indicate an increased sensitivity of the skin to external stimulus; Larger values of
  indicate that the inflammation is persistent.
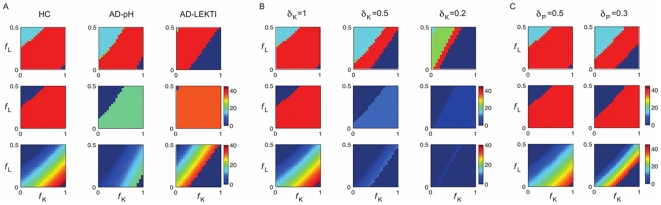
 pair of feedback strength
  and
and  . KLK production rate is higher at the bottom right corner. (Top) Bifurcation patterns with colours corresponding to those in Fig. 4A. Stronger KLK activation results in more severe symptoms of irreversible bistability. (Middle) Inflammation threshold
  for bistability patterns;
  for monostability patterns. (Bottom) Range of bistability
  for reversible bistability;
  for other patterns. The inflammation is more persistent (
 is larger) with stronger KLK activation. A: Comparison for HC, AD-LEKTI, and AD-pH. AD conditions exhibit smaller
  and more severe symptoms than HC. B: Comparison for different degradation rates for KLK5 and KLK5* in HC with
  (nominal),
  and
and  . Slower KLK5 degradation (smaller
  ) results in the stronger KLK activity and shows similar effects as in AD-pH condition leading to more irreversible bistability patterns and lower threshold values. C: Comparison for different degradation rates for PAR2 and PAR2* in HC with
  (nominal) and
  . Slower PAR2 degradation (smaller
  ) results in the stronger inflammation and shows similar effects as in AD-LEKTI condition leading to more irreversible bistability patterns and little changes in threshold values.
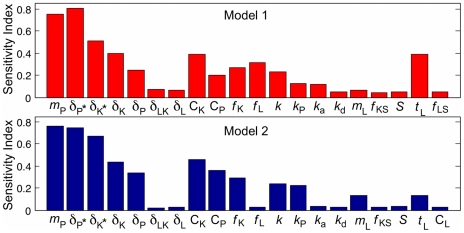
 = 2000 simulations for eFAST).
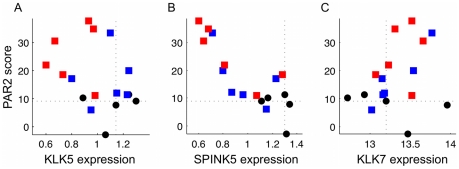
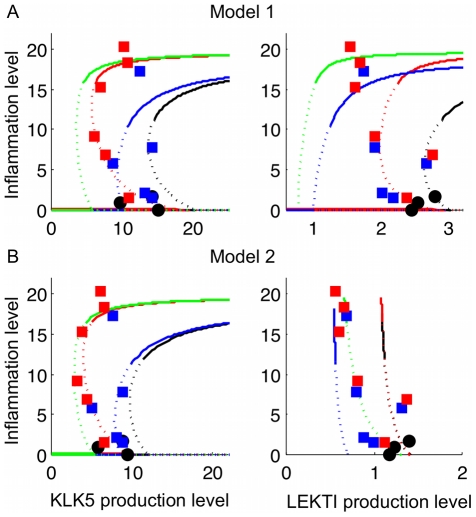
 and
and  , B: Model 2 with
  and
and  . Lines with different colours correspond to different conditions: HC (black), AD-LEKTI (blue), AD-pH (red), and AD-LEKTI/pH (green). Microarray data in Fig. 7 is plotted for comparison after scaling: PAR2 score (
 ) is scaled by
  , where
  is the median of
  for HC, to compare with the inflammation level; KLK5 (
 ) and SPINK5 expression (
 ) data are scaled by
  and
and  for comparison with Model 1, and
  and
and  for comparison with Model 2, where
  is the median of
  for HC. Data with positive values are only shown here.
References
-
- Callard RE, Harper JI. The skin barrier, atopic dermatitis and allergy: a role for langerhans cells? Trends Immunol. 2007;28:294–298. - PubMed
-
- Mancini AJCS, Kaulback K. The socioeconomic impact of atopic dermatitis in the united states: a systematic review. Pediatr Dermatol. 2008;25:1–6. - PubMed
-
- Cork MJ, Danby SG, Vasilopoulos Y, Hadgraft J, Lane ME, et al. Epidermal barrier dysfunction in atopic dermatitis. J Invest Dermatol. 2009;129:1892–1908. - PubMed
-
- Eichenfield LF, Hanifin JM, Luger TA, Stevens SR, Pride HB. Consensus conference on pediatric atopic dermatitis. J Am Acad Dermatol. 2003;49:1088–1095. - PubMed
Publication types
MeSH terms
Substances
LinkOut - more resources
Full Text Sources
Other Literature Sources
