

Proportion statistics to detect differentially expressed genes: a comparison with log-ratio statistics
- PMID: 21649912
- PMCID: PMC3224106
- DOI: 10.1186/1471-2105-12-228
Proportion statistics to detect differentially expressed genes: a comparison with log-ratio statistics
Abstract
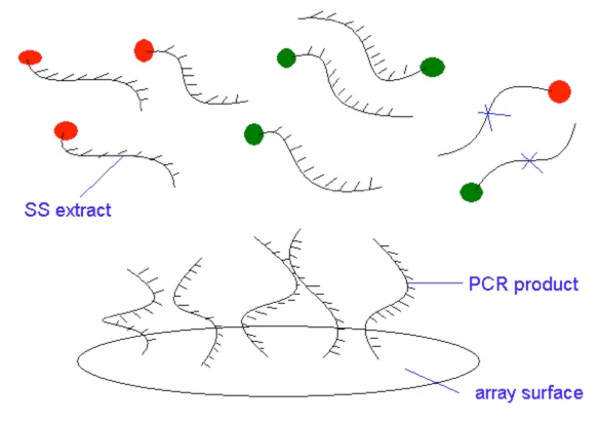
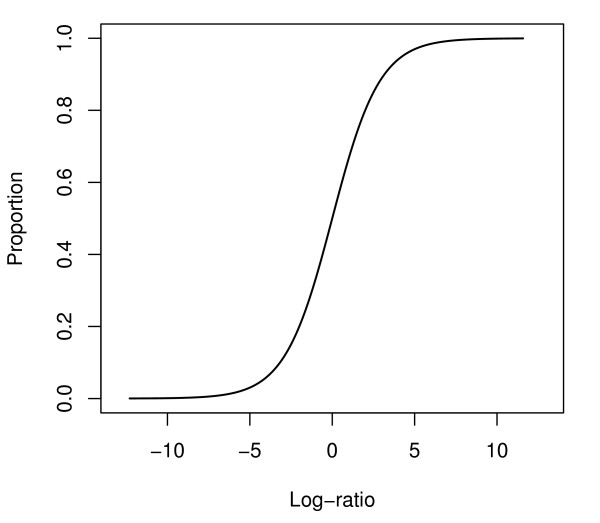
Background: In genetic transcription research, gene expression is typically reported in a test sample relative to a reference sample. Laboratory assays that measure gene expression levels, from Q-RT-PCR to microarrays to RNA-Seq experiments, will compare two samples to the same genetic sequence of interest. Standard practice is to use the log(2)-ratio as the measure of relative expression. There are drawbacks to using this measurement, including unstable ratios when the denominator is small. This paper suggests an alternative estimate based on a proportion that is just as simple to calculate, just as intuitive, with the added benefit of greater numerical stability.
Results: Analysis of two groups of mice measured with 16 cDNA microarrays found similar results between the previously used methods and our proposed methods. In a study of liver and kidney samples measured with RNA-Seq, we found that proportion statistics could detect additional differentially expressed genes usually classified as missing by ratio statistics. Additionally, simulations demonstrated that one of our proposed proportion-based test statistics was robust to deviations from distributional assumptions where all other methods examined were not.
Conclusions: To measure relative expression between two samples, the proportion estimates that we propose yield equivalent results to the log(2)-ratio under most circumstances and better results than the log(2)-ratio when expression values are close to zero.
Figures
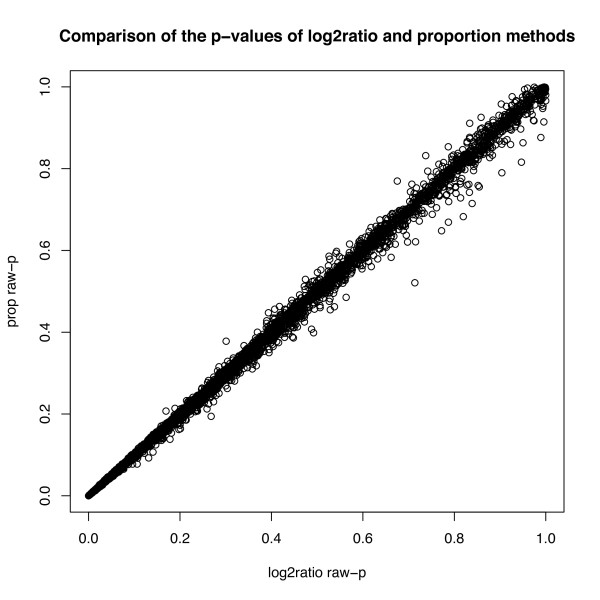
 and proportion
  for the mouse data. The general ordering of the genes is similar, although not identical, using the two methods.
References
-
- Canales R, Luo Y, Willey J, Austermiller B, Barbacioru C, Boysen C, Hunkapiller K, Jensen R, Knight C, Lee K, Ma Y, Maqsodi B, Papallo A, Peters E, Poulter K, Ruppel P, Samaha R, Shi L, Yang W, Zhang L, Goodsaid F. Evaluation of DNA microarray results with quantitative gene expression platforms. Nature Biotechnology. 2006;24:1115–1122. doi: 10.1038/nbt1236. - DOI - PubMed
Publication types
MeSH terms
Substances
LinkOut - more resources
Full Text Sources
Other Literature Sources
Molecular Biology Databases
