

Nutritional and metabolic status of children with autism vs. neurotypical children, and the association with autism severity
- PMID: 21651783
- PMCID: PMC3135510
- DOI: 10.1186/1743-7075-8-34
Nutritional and metabolic status of children with autism vs. neurotypical children, and the association with autism severity
Abstract
Background: The relationship between relative metabolic disturbances and developmental disorders is an emerging research focus. This study compares the nutritional and metabolic status of children with autism with that of neurotypical children and investigates the possible association of autism severity with biomarkers.
Method: Participants were children ages 5-16 years in Arizona with Autistic Spectrum Disorder (n = 55) compared with non-sibling, neurotypical controls (n = 44) of similar age, gender and geographical distribution. Neither group had taken any vitamin/mineral supplements in the two months prior to sample collection. Autism severity was assessed using the Pervasive Development Disorder Behavior Inventory (PDD-BI), Autism Treatment Evaluation Checklist (ATEC), and Severity of Autism Scale (SAS). Study measurements included: vitamins, biomarkers of vitamin status, minerals, plasma amino acids, plasma glutathione, and biomarkers of oxidative stress, methylation, sulfation and energy production.
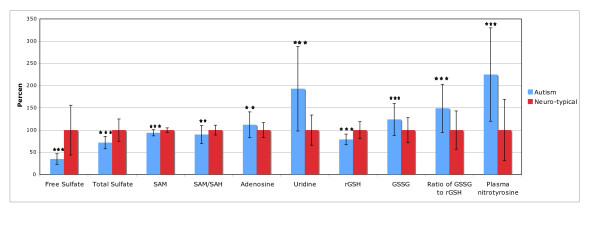
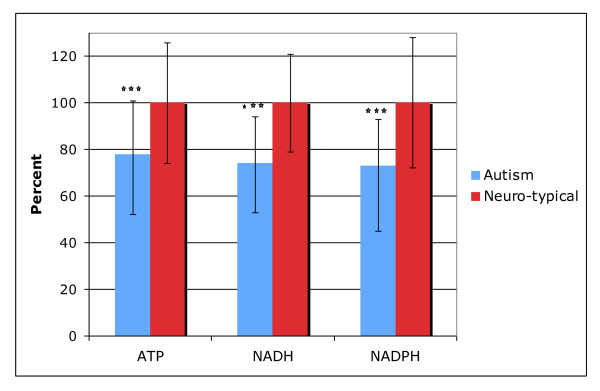
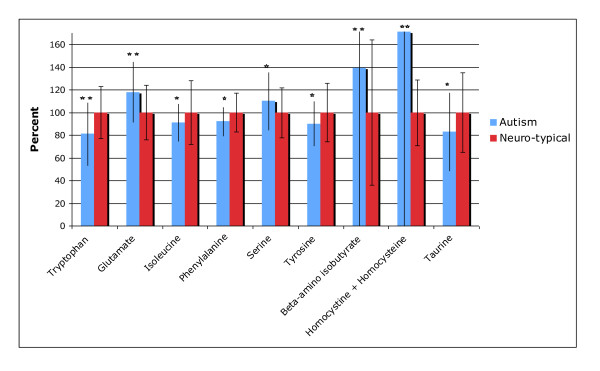
Results: Biomarkers of children with autism compared to those of controls using a t-test or Wilcoxon test found the following statistically significant differences (p < 0.001): Low levels of biotin, plasma glutathione, RBC SAM, plasma uridine, plasma ATP, RBC NADH, RBC NADPH, plasma sulfate (free and total), and plasma tryptophan; also high levels of oxidative stress markers and plasma glutamate. Levels of biomarkers for the neurotypical controls were in good agreement with accessed published reference ranges. In the Autism group, mean levels of vitamins, minerals, and most amino acids commonly measured in clinical care were within published reference ranges.A stepwise, multiple linear regression analysis demonstrated significant associations between several groups of biomarkers with all three autism severity scales, including vitamins (adjusted R2 of 0.25-0.57), minerals (adj. R2 of 0.22-0.38), and plasma amino acids (adj. R2 of 0.22-0.39).
Conclusion: The autism group had many statistically significant differences in their nutritional and metabolic status, including biomarkers indicative of vitamin insufficiency, increased oxidative stress, reduced capacity for energy transport, sulfation and detoxification. Several of the biomarker groups were significantly associated with variations in the severity of autism. These nutritional and metabolic differences are generally in agreement with other published results and are likely amenable to nutritional supplementation. Research investigating treatment and its relationship to the co-morbidities and etiology of autism is warranted.
Figures


References
-
- Harding KL, Judah RD, Gant CE. Outcome-based comparison of Ritalin versus food-supplement treated children with AD/HD. Alternative Medicine Review. 2003;8(3):319–330. - PubMed
-
- Nogovitsina OR, Levitina EV. Diagnostic value of examination of the magnesium homeostasis in children with attention deficit syndrome with hyperactivity. Klinicheskaia Laboratornaia Diagnostika. 2005;5:17–19. - PubMed
-
- Mousain-Bosc M, Roche M, Rapin J, Bali J-P. Magnesium vit B6 intake reduces central nervous system hyperexcitability in children. J American College of Nutrition. 2004;23(5):545S–548S. - PubMed
LinkOut - more resources
Full Text Sources
Other Literature Sources
Medical
