Comparative Study
. 2011 Jun 8;15(3):R139.
doi: 10.1186/cc10262.

A comparison of estimates of glomerular filtration in critically ill patients with augmented renal clearance

Affiliations
Comparative Study

A comparison of estimates of glomerular filtration in critically ill patients with augmented renal clearance

João Pedro Baptista et al. Crit Care. .

Abstract

Introduction: Increasingly, derived estimates of glomerular filtration, such as the modification of diet in renal disease (MDRD) equation and Cockcroft-Gault (CG) formula are being employed in the intensive care unit (ICU). To date, these estimates have not been rigorously validated in those with augmented clearances, resulting in potentially inaccurate drug prescription.

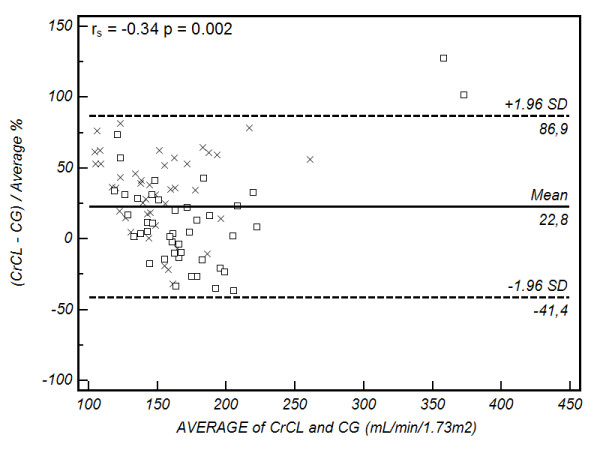
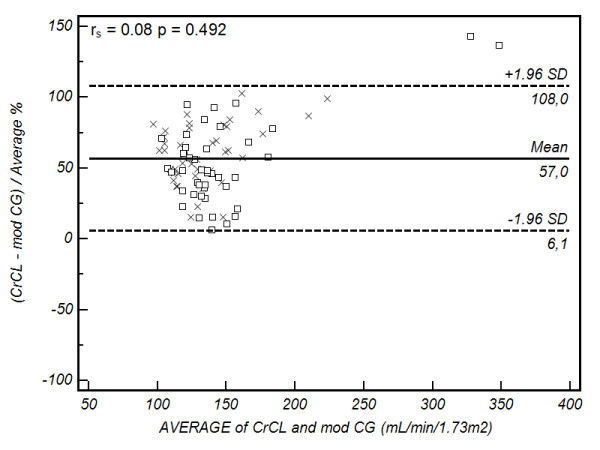
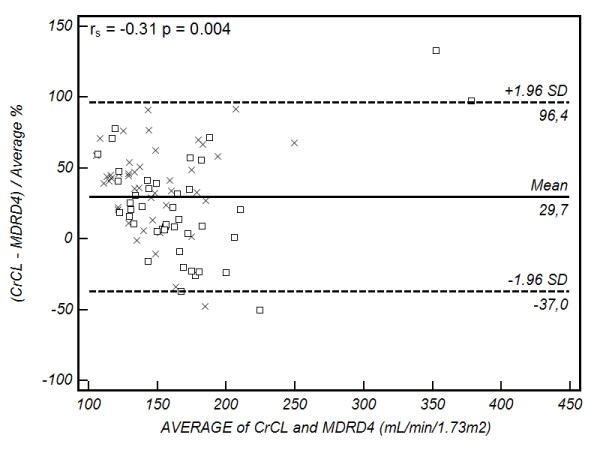
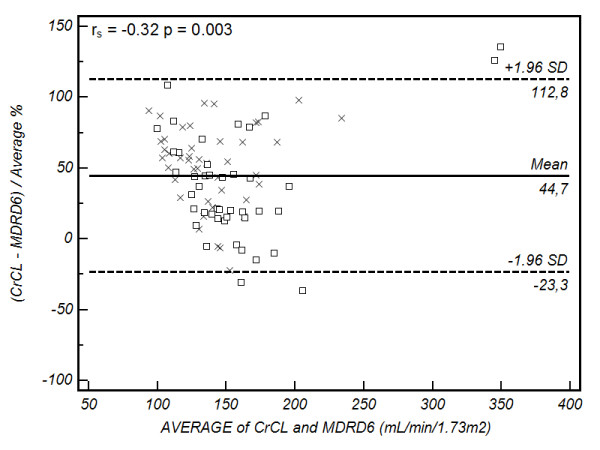
Methods: Post-hoc analysis of prospectively collected data in two tertiary level ICU's in Australia and Portugal. Patients with normal serum creatinine concentrations manifesting augmented renal clearance (ARC) (measured creatinine clearance (CLCR) > 130 ml/min/1.73 m2) were identified by chart review. Comparison between measured values and MDRD and CG estimates were then undertaken. Spearman correlation coefficients (rs) were calculated to determine goodness of fit, and precision and bias were assessed using Bland-Altman plots.

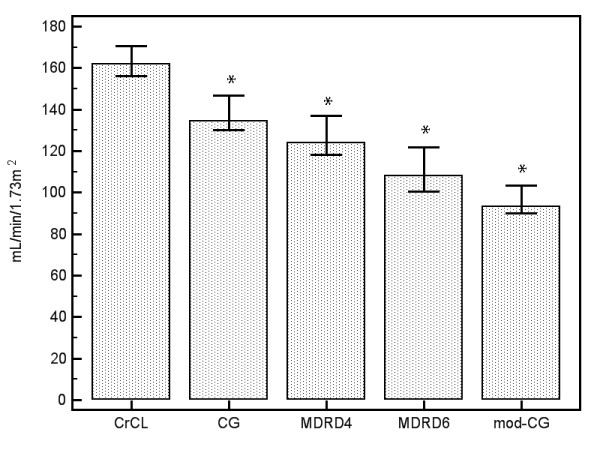
Results: Eighty-six patients were included in analysis. The median [IQR] measured CLCR was 162 [145-190] ml/min/1.73 m2, as compared to 135 [116-171], 93 [83-110], 124[102-154], and 108 [87-135] ml/min/1.73 m2 estimated by CG, modified CG, 4-variable MDRD and 6-variable MDRD formulae. All of the equations significantly under-estimated the measured value, with CG displaying the smallest bias (39 ml/min/1.73 m2). Although a moderate correlation was noted between CLCR and CG (rs = 0.26, P = 0.017) and 4-variable MDRD (rs = 0.22, P = 0.047), neither had acceptable precision for clinical application in this setting. CG estimates had the highest sensitivity for correctly identifying patients with ARC (62%).

Conclusions: Derived estimates of GFR are inaccurate in the setting of ARC, and should be interpreted with caution by the physician. A measured CLCR should be performed to accurately guide drug dosing.


Figures

Figure 1
Figure 1
Comparison of median measured and estimated glomerular filtration rate. Median values (95% confidence interval) for measured and estimated glomerular filtration rate. All mathematical equations significantly underestimate the measured value,'star' indicates P<0.01 when compared with measured creatinine clearance (CLCR). The modified Cockcroft-Gault (modCG) formula performs the most poorly in this setting. CG, Cockcroft-Gault; MDRD_4, 4-variable modification of diet in renal disease equation; MDRD_6, 6-variable modification of diet in renal disease equation.
Figure 2
Figure 2
Bland-Altman plot of CLCR vs Cockcroft Gault formula. Comparison of the difference between the measured creatinine clearance (CLCR) and Cockcroft Gault (CG) formula (as a percentage) on the y-axis, versus the average value obtained on the x-axis. The solid line represents the bias (mean percentage difference obtained across the range of values), where as the dashed lines are the limits of agreement (+/- 1.96 × standard deviation (SD)). square, Australia cohort; cross, Portugal cohort. The Spearman correlation coefficient (rs) for the percentage difference and average value is provided in the top left hand corner (outliers excluded).
Figure 3
Figure 3
Bland-Altman plot of CLCR vs modified Cockcroft Gault formula. Comparison of the difference between the measured creatinine clearance (CLCR) and modified Cockcroft Gault (modCG) formula (as a percentage) on the y-axis, versus the average value obtained on the x-axis. The solid line represents the bias (mean percentage difference obtained across the range of values), where as the dashed lines are the limits of agreement (+/- 1.96 × standard deviation (SD)). square, Australia cohort; cross, Portugal cohort. The Spearman correlation coefficient (rs) for the percentage difference and average value is provided in the top left hand corner (outliers excluded).
Figure 4
Figure 4
land-Altman plot of CLCR vs 4-variable modification of diet in renal disease equation. Comparison of the difference between the measured creatinine clearance (CLCR) and 4-variable modification of diet in renal disease equation (MDRD_4) (as a percentage) on the y-axis, versus the average value obtained on the x-axis. The solid line represents the bias (mean percentage difference obtained across the range of values), where as the dashed lines are the limits of agreement (+/- 1.96 × standard deviation (SD)). square, Australia cohort; cross, Portugal cohort. The Spearman correlation coefficient (rs) for the percentage difference and average value is provided in the top left hand corner (outliers excluded).
Figure 5
Figure 5
Bland-Altman plot of CLCR vs 6-variable modification of diet in renal disease equation. Comparison of the difference between the measured creatinine clearance (CLCR) and 6-variable modification of diet in renal disease equation (MDRD_6) (as a percentage) on the y-axis, versus the average value obtained on the x-axis. The solid line represents the bias (mean percentage difference obtained across the range of values), where as the dashed lines are the limits of agreement (+/- 1.96 × standard deviation (SD)). square, Australia cohort; cross, Portugal cohort. The Spearman correlation coefficient (rs) for the percentage difference and average value is provided in the top left hand corner (outliers excluded).

References

    1. Stevens LA, Coresh J, Greene T, Levey AS. Assessing kidney function--measured and estimated glomerular filtration rate. N Engl J Med. 2006;354:2473–2483. doi: 10.1056/NEJMra054415. - DOI - PubMed
    1. Levey AS, Bosch JP, Lewis JB, Greene T, Rogers N, Roth D. A more accurate method to estimate glomerular filtration rate from serum creatinine: a new prediction equation. Modification of Diet in Renal Disease Study Group. Ann Intern Med. 1999;130:461–470. - PubMed
    1. Martin JH, Fay MF, Ungerer JP. eGFR--use beyond the evidence. Med J Aust. 2009;190:197–199. - PubMed
    1. Cockcroft DW, Gault MH. Prediction of creatinine clearance from serum creatinine. Nephron. 1976;16:31–41. doi: 10.1159/000180580. - DOI - PubMed
    1. Bone RC, Balk RA, Cerra FB, Dellinger RP, Fein AM, Knaus WA, Schein RM, Sibbald WJ. Definitions for sepsis and organ failure and guidelines for the use of innovative therapies in sepsis. The ACCP/SCCM Consensus Conference Committee. American College of Chest Physicians/Society of Critical Care Medicine. Chest. 1992;101:1644–1655. doi: 10.1378/chest.101.6.1644. - DOI - PubMed

Publication types