. 2011 Sep 1;17(17):5812-21.
doi: 10.1158/1078-0432.CCR-11-0695. Epub 2011 Jun 7.

MicroRNA-10b expression correlates with response to neoadjuvant therapy and survival in pancreatic ductal adenocarcinoma

Affiliations

MicroRNA-10b expression correlates with response to neoadjuvant therapy and survival in pancreatic ductal adenocarcinoma

Meir Preis et al. Clin Cancer Res. .

Abstract

Introduction: Pancreatic ductal adenocarcinoma (PDAC) is a lethal malignancy. Diagnosis and management of PDAC are hampered by the absence of sensitive and specific disease biomarkers. MicroRNAs (miRNA) are noncoding regulatory RNAs involved in initiation and progression of human cancers. In this study, we sought to determine whether miR-10b could serve as a biomarker for PDAC.

Experimental design: miRNA expression was characterized by fluorescence-based in situ hybridization using locked nucleic acid-modified DNA probes against miR-10b, miR-21, miR-155, miR-196a, and miR-210, followed by codetection of proteins by immunohistochemistry on the same tissue sections. miRNA expression in surgically resected PDAC tissues and in endoscopic ultrasonography (EUS)-guided fine-needle aspirate (EUS-FNA) samples was analyzed in cytokeratin 19 (CK19)-positive epithelial cells using optical intensity analysis.

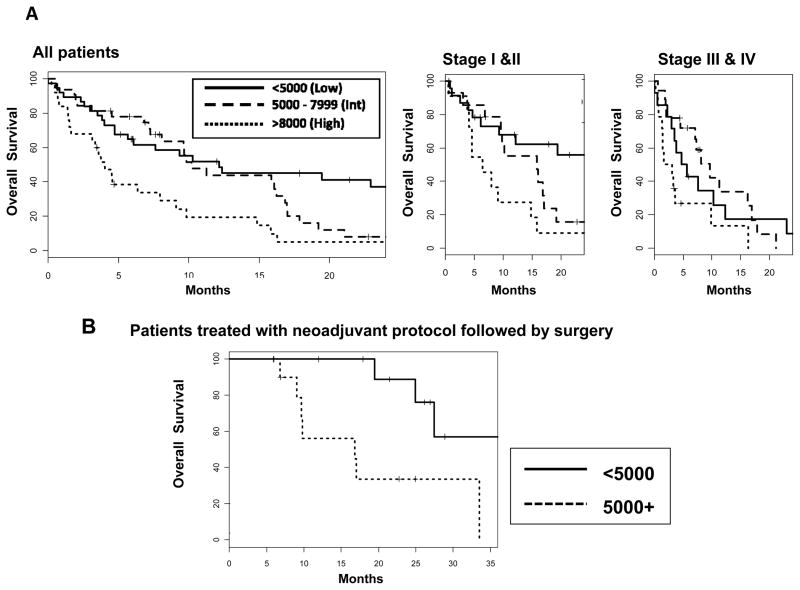
Results: In 10 resected PDAC samples, miR-10b was the most frequently and consistently overexpressed miRNA among characterized miRNAs, exhibiting a four-fold increase in the cancer cells (P = 0.012). Given this preferential overexpression of miR-10b, we sought to determine whether miR-10b expression was clinically relevant. Accordingly, miR-10b expression was examined in 106 EUS-FNA samples obtained from pancreatic lesions. miR-10b expression was increased in cancer cells compared with CK19-positive epithelial cells in benign lesions (P = 0.0001). In patients with PDACs, lower levels of miR-10b were associated with improved response to multimodality neoadjuvant therapy, likelihood of surgical resection, delayed time to metastasis, and increased survival.

Conclusion: miR-10b is a novel diagnostic biomarker for PDACs when assessing pancreatic lesions. Expression of miR-10b is predictive of response to neoadjuvant therapy and outcome in this disease.


Conflict of interest statement

Conflict of interest: None

Figures

Figure 1
Figure 1. Spatial characterization of microRNA expression in resected pancreatic tissues
A. Expression of miR-10b, snRNA U6, CK19 and amylase was determined in a single tissue section from normal pancreas (upper panels) and a single tissue section (4-μm thick) from a PDAC sample (lower panels). H&E staining was performed on the respective consecutive tissue section to reveal tissue morphology. Original magnification: 200X; scale bar: 100 μm. B. Heatmap displays fluorescence intensity of miR-10b, miR-21, miR-155, miR-196 and miR-210 signal in CK19-positive cells in a panel of 10 PDAC samples and three benign pancreatic lesions. C. Bar graph displays mean fluorescence intensity of the miR-10b signal in the CK19-positive cells in a panel of 8 PDAC lesions and adjoining normal pancreas. *p=0.006 when compared with mean value in normal pancreas.
Figure 2
Figure 2. Spatial characterization of miR-10b expression in EUS-FNA smaples from pancreatic lesions
A. Expression of miR-10b, snRNA U6 and CK19 was sequentially determined in a single tissue section from FNA-derived benign (upper panels) and a single tissue section from a PDAC (lower panels) sample. H&E staining was performed on the respective consecutive tissue section to reveal tissue morphology. Original magnification: 200X; scale bar: 100 μm. B. Box & whisker plot of miR-10b levels in FNA samples obtained from benign (n=11) and PDAC (n=95) lesions. *p<0.001 when compared with corresponding value in benign lesions.
Figure 3
Figure 3. Levels of miR-10b predict response to multimodality neoadjuvant treatment
A. Box & whisker plot summarizes data for miR-10b levels in FNA samples (n=44) grouped with respect to radiological response in patients who received multimodality neoadjuvant treatment (Please see Table 1). p=0.0012 for the correlation between miR-10b levels and radiological response. B. Box & whisker plot depicts miR-10b levels in FNA samples (n=18) grouped with respect to radiological response in patients who received palliative gemcitabine-based chemotherapy. DP: disease progression; SD: stable disease; PR: partial response; CR: complete response. C. Low miR-10b levels in patients with stage I-II PDAC predicted response to multimodality neoadjuvant treatment and surgical resection (p=0.01).
Figure 4
Figure 4. Levels of miR-10b and time to metastasis
A. miR-10b expression was characterized in 95 EUS-FNA samples from PDAC patients. Representative images of EUS-FNA samples with low (<5000 a.u.), intermediate (5000–7999 a.u.) and high (>8000 a.u.) levels of miR-10b expression are shown. White arrows mark areas of interest. B. Kaplan-Meier plots display time to metastasis based on different levels of miR-10b expression for all patients or for patients grouped by stage at diagnosis. The median time for progression to metastatic disease (3.7 months) was significantly shorter (p=0.001) in patients with high miR-10b expression compared to patients with intermediate (7.1 months) or low levels of expression (8.1 months).
Figure 5
Figure 5. miR-10b levels negatively correlate with overall survival
miR-10b expression was characterized in 95 EUS-FNA samples from PDAC patients. A. Kaplan- Meier plots display overall survival curves based on different levels of miR-10b expression: low (<5000 a.u.), intermediate (5000–7999 a.u.) and high (>8000 a.u.) for all patients, or for patients grouped by Stage at diagnosis. In patients with stage I or II disease at diagnosis, high levels of miR-10b were associated with decreased survival compared to the patients with low levels of miR-10b (p=0.0032) B. Kaplan-Meier plots display overall survival curves based on different levels of miR-10b expression for patients who received multimodality neoadjuvant chemo-radiotherapy followed by surgery. Patients with high miR-10b expression in the FNA samples (5000+) had significantly shorter survival by comparison to patients with low miR-10b levels (<5000, p=0.02).

Comment in

References

    1. Bilimoria KY, Bentrem DJ, Ko CY, Ritchey J, Stewart AK, Winchester DP, et al. Validation of the 6th edition AJCC Pancreatic Cancer Staging System: report from the National Cancer Database. Cancer. 2007 Aug 15;110(4):738–44. - PubMed
    1. Preis M, Korc M. Kinase signaling pathways as targets for intervention in pancreatic cancer. Cancer Biol Ther. 2010 May 10;9(10) - PubMed
    1. Kahl S, Malfertheiner P. Role of endoscopic ultrasound in the diagnosis of patients with solid pancreatic masses. Dig Dis. 2004;22(1):26–31. - PubMed
    1. Sener SF, Fremgen A, Menck HR, Winchester DP. Pancreatic cancer: a report of treatment and survival trends for 100,313 patients diagnosed from 1985–1995, using the National Cancer Database. J Am Coll Surg. 1999 Jul;189(1):1–7. - PubMed
    1. Lim JE, Chien MW, Earle CC. Prognostic factors following curative resection for pancreatic adenocarcinoma: a population-based, linked database analysis of 396 patients. Ann Surg. 2003 Jan;237(1):74–85. - PMC - PubMed

Publication types