. 2011 Jul 1;124(Pt 13):2310-20.
doi: 10.1242/jcs.084046. Epub 2011 Jun 7.

Arginine methylation of G3BP1 in response to Wnt3a regulates β-catenin mRNA

Affiliations

Arginine methylation of G3BP1 in response to Wnt3a regulates β-catenin mRNA

Rama Kamesh Bikkavilli et al. J Cell Sci. .

Abstract

Wnt/β-catenin signaling is essential for normal mammalian development. Wnt3a activates the Wnt/β-catenin pathway through stabilization of β-catenin; a process in which the phosphoprotein Dishevelled figures prominently. Protein arginine methylation in signaling complexes containing Dishevelled was investigated. Mass spectrometry of a prominent arginine-methylated, Dishevelled-associated protein identified the Ras GTPase activating protein-binding protein 1 G3BP1. Stimulation of totipotent mouse embryonic F9 cells with Wnt3a provoked increased methylation of G3BP1. We show that G3BP1 is a novel Ctnnb1 mRNA binding protein. Methylation of G3BP1 constitutes a molecular switch that regulates Ctnnb1 mRNA in response to Wnt3a. Thus, the protein arginine methylation that targets G3BP1 acts as a novel regulator of Ctnnb1 mRNA.


Figures

Fig. 1.
Fig. 1.
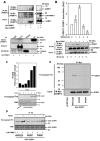
G3BP1 is a Dishevelled-associated methylated protein. (A) F9 cells were treated with Wnt3a for different durations as indicated, followed by cell lysis and affinity pull-downs with anti-Dvl3 mouse monoclonal antibody. Methylation status of Dvl3-based complexes was then visualized by probing the blots with antibodies that specifically detect either mono or di-methyl arginines on proteins. Strong Wnt-induced methylation of a Disheveled-associated protein was observed in the molecular range of 50–80 kDa. (B) Fragment ion (MS/MS) spectrum resulting from a doubly charged peptide isolated from the excised band of interest. Monomethylation at R433 of full-length G3BP1 was detected. (C) Primary sequence of mouse G3BP1. Six peptides (Highlighted in red) sequenced from the polypeptides co-purified with Dvl3 matched G3BP1. One peptide (highlighted in blue) was monomethylated. (D) Schematic representation of G3BP1 structure, displaying the NTF2-like domain, an RNA recognition motif and an RG-rich motif.
Fig. 2.
Fig. 2.
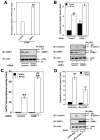
G3BP1 interacts with Dvl3. (A) F9 cells were transiently transfected with Myc–G3BP1 either alone or with HA–Dvl3-GFP2 for 24 hours followed by cell lysis and affinity pull-downs with anti-HA antibodies. Interaction of G3BP1 with Dvl3 was visualized by probing the blots with anti-Myc antibodies. (B) F9 cells were transfected either with HA–Dvl3–GFP2 alone or with full-length G3BP1 (1–465), its N-terminal half (1–240) or its C-terminal half (241–465) for 24 hours followed by cell lysis and affinity pull-downs with anti-HA antibodies. Interaction of G3BP1 with Dvl3 was visualized by probing the blots with anti-Myc antibodies. (C) F9 cells were transiently transfected with empty vector or Myc–G3BP1 for 24 hours. The cells were then treated with Wnt3a (20 ng/ml) for indicated periods of time followed by cell lysis and affinity pull-downs with anti-Dvl3 specific antibodies followed by immunoblotting with anti-Myc antibodies. Top panel displays mean values ± s.e.m. obtained from three independent highly reproducible experiments; the lower panel displays representative blots. Asterisks indicate the bands of immunoglobulin heavy and light chains. Representative blots of three independent experiments that proved highly reproducible are displayed. **P<0.01 versus control (–Wnt3a).
Fig. 3.
Fig. 3.
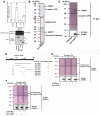
PRMT1 binds to and methylates G3BP1. (A) Ectopic PRMT1 interacts with G3BP1. F9 cells were transiently transfected with Myc–G3BP1 either alone or with HA–PRMT1 for 24 hours followed by cell lysis and affinity pull-downs with anti-HA antibodies. Interaction of G3BP1 with PRMT1 was visualized by probing the blots with anti-Myc antibodies. F9 cells were transiently trasfected with HA–PRMT1 for 24 hours followed by cell lysis and affinity pull-downs with control IgG, anti-Dvl3, anti-GSK3β or anti-HA antibodies. The association of PRMT1 with different proteins was visualized by probing the blots with anti-HA antibodies. (B) F9 cells were transiently transfected with HA–PRMT1 and Myc–G3BP1 for 24 hours. The cells were then treated with Wnt3a (20 ng/ml) for indicated periods of time followed by cell lysis and affinity pull-downs with anti-HA specific antibodies followed by immunoblotting with anti-Myc antibodies. Top panel displays mean values ± s.e.m. obtained from three independent highly reproducible experiments; the bottom panel displays representative blots. Asterisks indicate the bands of Immunoglobulin heavy chain. Representative blots of three independent experiments that proved highly reproducible were displayed. *P<0.05 versus unstimulated control (–Wnt3a). (C) In vitro methylation assay for G3BP1. F9 cells were transiently transfected with empty vector or HA–PRMT1 for 24 hours. The cells were then treated with Wnt3a (20 ng/ml) for indicated periods of time followed by cell lysis and affinity pull-downs with anti-HA specific antibodies followed by an in vitro methylation assay using recombinant GST–G3BP1 as substrate and [3H]SAM as a methyl donor. Top panel displays the d.p.m. of the incorporated tritiated methyl groups measured from the excised bands of the SDS-PAGE gel and the bottom panel displays a representative fluorograph. (D) In vitro methylation assay for G3BP1 mutants. F9 cells were transiently transfected with HA–PRMT1 for 24 hours. The cells were then treated with Wnt3a (20 ng/ml) for 6 h followed by cell lysis and affinity pull-downs with anti-HA specific antibodies followed by an in vitro methylation assay using recombinant GST–G3BP1 and its mutants R433K or R445K as substrates and [3H]SAM as a methyl donor. Representative data of two independent experiments that proved highly reproducible were displayed. (E) In vivo methylation of G3BP1. F9 cells were transiently transfected with empty vector, Myc–G3BP1, or G3BP1 mutants for 24 hours. The cells were then metabolically labeled with L-[methyl-3H]methionine in the presence of protein translation inhibitors. After 3 hours, the cells were lysed and affinity pull-downs with anti-Myc antibodies were performed. The methylation statuses of G3BP1 and its mutants were then revealed by SDS-PAGE followed by fluorography. After fluorography, the gels were rehydrated, transferred to nitrocellulose membranes followed by immunoblotting with anti-Myc antibodies (bottom panel). Representative data of two independent experiments that proved highly reproducible were displayed.
Fig. 4.
Fig. 4.
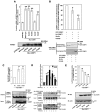
G3BP1 negatively regulates Wnt/β-catenin signaling. (A) F9 cells were treated with either control siRNAs (100 nM) or siRNAs specific to mouse G3bp1 (100 nM) for 48 hours and the levels of mRNA encoding β-catenin and cyclophilin A were quantified using quantitative PCR. The data represent normalized Ctnnb1 mRNA to the Ppia (cyclophilin A) mRNA levels (mean values ± s.e.m.) from two independent experiments whose results were in high agreement. **P<0.01 versus control (control siRNA). F9 cells were treated with either control siRNA (100 nM) or siRNAs specific for mouse G3bp1 (100 nM) for 48 hours and the lysates were assayed either for cytosolic β-catenin levels (B) or Lef/Tcf-sensitive transcription (C). Top panel displays mean values ± s.e.m. obtained from three independent experiments; the bottom panel displays representative blots. *P<0.05; **P<0.01 versus unstimulated control (–Wnt3a). ##P<0.01 versus stimulated control (+Wnt3a). (D) F9 cells were transfected with Myc–G3BP1 for 24 hours and the lysates were assayed for cytosolic β-catenin stabilization. Top panel displays mean values ± s.e.m. obtained from three independent experiments; the bottom panel displays representative blots. **P<0.01 versus unstimulated control (–Wnt3a). ##P<0.01 versus stimulated control (+Wnt3a).
Fig. 5.
Fig. 5.
G3BP1 binds Ctnnb1 mRNA. (A) RNA immunoprecipitation assay was performed on F9 cell lysates expressing either empty vector, full-length G3BP1 (1–465), its N-terminal half (1–240) or its C-terminal half (241–465) with anti-myc antibodies. Ctnnb1 mRNA in the immunoprecipitates was quantified using quantitative PCR. The top panel represents mean values ± s.e.m. obtained from two independent experiments; the bottom panel displays representative gel picture of two independent experiments that proved highly reproducible. **P<0.01 versus control (pCMV-Myc). (B,C) Northwestern analysis of interaction of G3BP1 with Ctnnb1 mRNA. Recombinant GST or GST–G3BP1 (B) or immunoprecipitated Myc–G3BP1 from F9 cell lysates (C) were separated by SDS-PAGE and transferred onto nitrocellulose membranes. Northwestern analysis was then performed either using DIG-labeled Ctnnb1 UTR or Gapdh UTR probes. The top panels represent northwestern blots whereas the lower panels display either Ponceau S staining (B) or immunoblotting with anti-Myc antibodies for the same blots. (DF) Identification of G3BP1 binding region within the 3′-UTR of Ctnnb1 mRNA. Immunoprecipitated Myc–G3BP1 from F9 cell lysates were separated on SDS-PAGE gels and transferred onto nitrocellulose membranes. Northwestern analysis was then performed using truncated versions of DIG-labeled Ctnnb1 UTR probes. The top panels represent northwestern blots, whereas lower panels display immunoblots with anti-Myc antibodies. Representative data of two independent experiments that proved highly reproducible are displayed.
Fig. 6.
Fig. 6.
Arginine methylation of G3BP1 impairs its binding to Ctnnb1 mRNA and Dvl3. (A) RNA immunoprecipitation assay was performed on F9 cell lysates expressing either empty vector, wild-type G3BP1, its methylation-deficient mutants (433K, 445K) or its methylation-mimicking mutants (433F, 445F) with anti-Myc antibodies. The amount of Ctnnb1 mRNA in the immunoprecipitates was then quantified using quantitative PCR. **P<0.01 versus control (pCMV-Myc). (B) Northwestern analysis of unmethylated or methylated GST–G3BP1 and Ctnnb1 mRNA. Equal amounts of unmethylated or methylated (with PRMT1 isolated from unstimulated cells or cells treated with Wnt3a for 6 hours and [3H]SAM) GST-G3BP1 were separated on SDS-PAGE gels and transferred onto nitrocellulose membranes. Northwestern analysis was then performed on the blots using DIG-labeled Ctnnb1 UTR. The binding of Ctnnb1 mRNA to unmethylated GST–G3BP1 was taken as 100%. The top panel represents mean values ± s.e.m. obtained from three independent experiments; the bottom panels display northwestern blots and the corresponding fluorograph. *P<0.05; **P<0.01 versus control (unmethylated GST–G3BP1). (C) F9 cells were transiently transfected with either pCMV–Myc, Myc–G3BP1 or its methylation-deficient mutants (R433K, R445K) for 24 hours followed by cell lysis and affinity pull-downs with anti-Dvl3 antibodies. Interaction of G3BP1 and its mutants with Dvl3 was made visible by probing the blots with anti-Myc antibodies. Top panel displays mean values ± s.e.m. obtained from three independent experiments; bottom panel displays representative blots. **P<0.01 versus control (WT). (D) F9 cells were transiently transfected with methylation-deficient mutants of Myc–G3BP1 (R433K, R445K) for 24 hours. The cells were then treated with Wnt3a (20 ng/ml) for indicated periods of time followed by cell lysis and affinity pull-downs with anti-Dvl3 antibodies followed by immunoblotting with anti-Myc antibodies. Top panel displays mean values ± s.e.m. obtained from three independent highly reproducible experiments; the bottom panel displays representative blots. *P<0.05; **P<0.01 versus corresponding unstimulated control (–Wnt3a). (E) F9 cells were transfected either with Myc–G3BP1 or its methylation-deficient mutants (R433K, R445K) for 24 hours and the lysates were assayed for Lef/Tcf-sensitive transcription following stimulation with Wnt3a for 7 hours. Top panel displays mean values ± s.e.m. obtained from three independent highly reproducible experiments; bottom panel displays representative blots. ##P<0.01 versus control (pCMV-Myc).
Fig. 7.
Fig. 7.
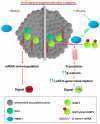
Arginine methylation of G3BP1 regulates both Ctnnb1 mRNA and canonical Wnt/β-catenin signaling. In the absence of Wnt stimulation (–Wnt3a), the G3BP1of Dvl3-based supermolecular complex (signalsomes) binds and regulates Ctnnb1 mRNA (left). Stimulation of cells by Wnt3a activates PRMT1, which methylates G3BP1, provoking release of Ctnnb1 mRNA as well as release of G3BP1 from the signalsome. Increased Ctnnb1 mRNA provokes increased accumulation of β-catenin and activation of canonical Wnt pathway via Lef/Tcf-sensitive gene transcription.

References

    1. Aghib D. F., McCrea P. D. (1995). The E-cadherin complex contains the src substrate p120. Exp. Cell Res. 218, 359-369 - PubMed
    1. Angers S., Moon R. T. (2009). Proximal events in Wnt signal transduction. Nat. Rev. Mol. Cell Biol. 10, 468-477 - PubMed
    1. Atlas R., Behar L., Elliott E., Ginzburg I. (2004). The insulin-like growth factor mRNA binding-protein IMP-1 and the Ras-regulatory protein G3BP associate with tau mRNA and HuD protein in differentiated P19 neuronal cells. J. Neurochem. 89, 613-626 - PubMed
    1. Atlas R., Behar L., Sapoznik S., Ginzburg I. (2007). Dynamic association with polysomes during P19 neuronal differentiation and an untranslated-region-dependent translation regulation of the tau mRNA by the tau mRNA-associated proteins IMP1, HuD, and G3BP1. J. Neurosci. Res. 85, 173-183 - PubMed
    1. Bedford M. T., Clarke S. G. (2009). Protein arginine methylation in mammals: who, what, and why. Mol. Cell 33, 1-13 - PMC - PubMed

Publication types

MeSH terms