. 2011 Aug;39(15):e104.
doi: 10.1093/nar/gkr436. Epub 2011 Jun 7.

High-level transgene expression by homologous recombination-mediated gene transfer

Affiliations

High-level transgene expression by homologous recombination-mediated gene transfer

Mélanie Grandjean et al. Nucleic Acids Res. 2011 Aug.

Abstract

Gene transfer and expression in eukaryotes is often limited by a number of stably maintained gene copies and by epigenetic silencing effects. Silencing may be limited by the use of epigenetic regulatory sequences such as matrix attachment regions (MAR). Here, we show that successive transfections of MAR-containing vectors allow a synergistic increase of transgene expression. This finding is partly explained by an increased entry into the cell nuclei and genomic integration of the DNA, an effect that requires both the MAR element and iterative transfections. Fluorescence in situ hybridization analysis often showed single integration events, indicating that DNAs introduced in successive transfections could recombine. High expression was also linked to the cell division cycle, so that nuclear transport of the DNA occurs when homologous recombination is most active. Use of cells deficient in either non-homologous end-joining or homologous recombination suggested that efficient integration and expression may require homologous recombination-based genomic integration of MAR-containing plasmids and the lack of epigenetic silencing events associated with tandem gene copies. We conclude that MAR elements may promote homologous recombination, and that cells and vectors can be engineered to take advantage of this property to mediate highly efficient gene transfer and expression.


Figures

Figure 1.
Figure 1.
Analysis of the effect of MARs and successive stable transfections on gene transfer and expression. CHO DG44 cells were co-transfected with the GFP expression vector devoid of MAR element (GFP, dark line), or with the vector containing MAR 1–68 (MAR1–68GFP, red line), and with the pSVpuro plasmid mediating resistance to puromycin. Some of these cells were submitted to a second transfection with the same GFP expression vector but with a selection plasmid mediating neomycin resistance, either on the day following the first transfection (blue line) or after 2 weeks of selection for puromycin resistance (green line). After 2 weeks of selection for puromycin (single transfections), or 3 weeks of selection for both puromycin and neomycin resistance (double transfections at 1 day interval), or 2 weeks of selection for puromycin followed by the second transfection and two weeks of neomycin resistance selection (double transfections at 2 weeks interval), eGFP fluorescence was quantified by cytofluorometry. (A) Fluorescence distribution in polyclonal populations of GFP-expressing cells. The cell fluorescence profiles shown are representative of four independent experiments. (B) Histogram showing the percentage of total cells corresponding to non/low-expressors that display <10 relative light units (RLU), or cells that display medium and high (>100 RLU) or very-high (>1000 RLU) GFP fluorescence, as determined from the analysis of stable cell pools as shown in panel A. (C) The mean GFP fluorescence of each stable polyclonal cell pool was normalized to that obtained from the transfection of MARGFP and the average and standard deviation of four independent transfections is shown as a fold increase over the fluorescence obtained by one transfection without a MAR. Asterisks indicate significant differences in GFP expression (Student's t-test, P < 0.05). (D) FISH analysis of eGFP transgene chromosomal integration sites in cells singly or doubly transfected with or without the human MAR. Metaphase chromosomes spreads of stable cell pools were hybridized with the GFP plasmid without MAR, and representative illustrations of the results are shown. (E) Enlargements of chromosomes are shown to illustrate differences in fluorescence intensities.
Figure 2.
Figure 2.
Determination of the optimal timing between successive transfections. (A) Stable polyclonal populations were generated by a single transfection (minus symbol) or by two consecutive transfections of the MAR-GFP expression plasmid with the indicated time intervals. After 2 weeks of selection, mean GFP expression of the total polyclonal populations was determined. Fluorescence levels were normalized to the maximal values obtained and they are displayed as the fold increase over the expression obtained from a single transfection where n corresponds to the number of independent transfections. Asterisks indicate significant differences in GFP expression (Student's t-test, P < 0.05). (B) Analysis of cell cycle progression. At the time of first and second transfections, CHO cells were harvested and stained with propidium iodide (PI) and fluorescence was analyzed by cytofluorometry. The distribution of relative PI fluorescence represents the amount of genomic DNA per cell. The percentage of the population associated to each cell cycle state (G1, S, G2/M) is as indicated.
Figure 3.
Figure 3.
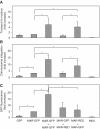
DNA transport, integration and expression upon successive transfections. (A) Amount of GFP transgenes transport into cell nuclei during single and double transient transfections with GFP or DsRed plasmids with or without a MAR. MAR-GFP + MAR-RED corresponds to a double transfection where MAR-GFP is transferred during the first transfection, whereas MAR-RED was used in the second transfection. Nuclei were isolated and total DNA was extracted one day after a single or after the second transfection, and the number of GFP transgenes transported into the nuclei was quantified by qPCR. Results were normalized to that of the reference CHO cell genomic GAPDH gene and represent the mean of four independent transfections. (B) Effect of the MAR and successive transfections on integrated GFP transgene copy number. Total genome-integrated transgene DNA was extracted from the previously described GFP-expressing cells after 3 weeks of selection of stable polyclonal cell pools, and DNA was quantified as for panel A. (C) Effect of MAR and successive transfections on GFP expression. The GFP fluorescence levels of the stable cell pools analyzed in panel B were assayed by cytofluorometry.
Figure 4.
Figure 4.
Subcellular distribution of transfected DNA. (A) Confocal microscopy analysis of DNA intracellular trafficking. Transient single or double transfections were performed in CHO cells using plasmids bearing or not a MAR labeled with Rhodamine and Cy5 fluorophores, as indicated. Transfected cells were fixed and stained with DAPI (blue) 3, 6, 21 h post-transfections. Cells expressing GFP appear in green on the pictures. (B) Quantification of the subcellular plasmid DNA distribution was performed on confocal laser microscopy performed for panel A, except that endosome/lysosome compartments were stained with LysoTracker Red DND-99. The pixel area of clusters derived from rhodamine or Cy5 fluorescence were used to estimate the amount of plasmid DNA in ∼120 cells.
Figure 5.
Figure 5.
The MAR, plasmid homology and homologous recombination mediate high transgene expression. (A) Stable polyclonal cell pools were generated by the transfection of plasmids bearing different transgenes (GFP or DsRed), MAR (MAR1 for the human 1–68 or MAR2 for the chicken lysozyme MAR), and/or bacterial resistance gene (ampicillin or kanamycin), and the relative average GFP fluorescence of four independent transfections are shown as the fold increase over that obtained from one transfection without MAR. Asterisks show significant differences in GFP expression (Student's t-test, P < 0.05). (B) Stable transfections with GFP or MAR1-68GFP plasmids were performed in the parental CHO cell line (AA8) and in mutants deficient either in the homologous recombination (51D1) or non-homologous end-joining (V3.3) pathway. The mean GFP fluorescence of each stable polyclonal cell pool generated from single (top panel) or two consecutive (bottom panel) transfections were normalized to that obtained from AA8 cells singly transfected with the MAR-devoid plasmid. Asterisks indicate significant differences in GFP expression (Student's t-test, P < 0.05). No stably transfected cells were obtained form the double transfection of 51D1 cells.

References

    1. Kalos M, Fournier RE. Position-independent transgene expression mediated by boundary elements from the apolipoprotein B chromatin domain. Mol. Cell. Biol. 1995;15:198–207. - PMC - PubMed
    1. Recillas-Targa F, Pikaart MJ, Burgess-Beusse B, Bell AC, Litt MD, West AG, Gaszner M, Felsenfeld G. Position-effect protection and enhancer blocking by the chicken beta-globin insulator are separable activities. Proc Natl Acad Sci USA. 2002;99:6883–6888. - PMC - PubMed
    1. Robertson G, Garrick D, Wu W, Kearns M, Martin D, Whitelaw E. Position-dependent variegation of globin transgene expression in mice. Proc. Natl Acad. Sci. USA. 1995;92:5371–5375. - PMC - PubMed
    1. Henikoff S. Dosage-dependent modification of position-effect variegation in Drosophila. Bioessays. 1996;18:401–409. - PubMed
    1. Wakimoto BT. Beyond the nucleosome: epigenetic aspects of position-effect variegation in Drosophila. Cell. 1998;93:321–324. - PubMed

Publication types