. 2011 Jul;138(13):2845-53.
doi: 10.1242/dev.063594.

The GUDMAP database--an online resource for genitourinary research

Affiliations

The GUDMAP database--an online resource for genitourinary research

Simon D Harding et al. Development. 2011 Jul.

Abstract

The GenitoUrinary Development Molecular Anatomy Project (GUDMAP) is an international consortium working to generate gene expression data and transgenic mice. GUDMAP includes data from large-scale in situ hybridisation screens (wholemount and section) and microarray gene expression data of microdissected, laser-captured and FACS-sorted components of the developing mouse genitourinary (GU) system. These expression data are annotated using a high-resolution anatomy ontology specific to the developing murine GU system. GUDMAP data are freely accessible at www.gudmap.org via easy-to-use interfaces. This curated, high-resolution dataset serves as a powerful resource for biologists, clinicians and bioinformaticians interested in the developing urogenital system. This paper gives examples of how the data have been used to address problems in developmental biology and provides a primer for those wishing to use the database in their own research.


Figures

Fig. 1.
Fig. 1.
GUDMAP database search page. The main access point to the GUDMAP gene expression data. Users can access the data via simple queries (A) or by browsing through the in situ and microarray data (B). It is also possible to use more advanced anatomy queries, accessed via the Boolean anatomy button (C). A quick search tool is accessible from all website pages, enabling fast queries in the gene, anatomy, accession ID and function categories (D).
Fig. 2.
Fig. 2.
GUDMAP gene expression summaries. A query for a gene, or list of genes, can be used to find where a gene(s) is expressed during development. The result of such a query returns a gene expression summary for that gene or genes. In this example, a query for Wnt4, Upk3a, Bmp2 and Wt1 has returned a list of four gene expression summaries, one for each gene. These summaries give an overview of the in situ and microarray gene expression data available for a gene. The microarray data are summarised as miniature heatmaps in the ‘Microarray expression profile’ column, which can be clicked to link to a more detailed heatmap page (see Fig. 3). The in situ data are presented as a simple bar chart, with the six coloured bars each representing an anatomical focus group [mesonephros (red), metanephros (green), lower urinary tract (purple) and early (pink), male (orange) and female (brown) reproductive systems]. A bar above the line indicates that the gene is present in that anatomy group, a bar below indicates that the gene is not detected. The bars link to lists of in situ entries (see Fig. 4). All in situ images for the gene are summarised in the image gallery (see Fig. 5), to which there is a link from the thumbnail in the ‘In situ expression images’ column. Expression summaries of many genes can be viewed at once, aiding quick comparisons of expression.
Fig. 3.
Fig. 3.
GUDMAP microarray expression profiles and heatmaps. Microarray expression profiles can be accessed through the link on a gene expression summary. Shown is a microarray expression profile for Wnt4 across components of the developing kidney in the form of a heatmap display. Each probe set of Wnt4 is displayed in an individual row of the heatmap display, with each column representing an individual microarray sample, each corresponding to a component of the developing kidney. Microarray expression profiles are available for components of the developing kidney, lower urinary tract and reproductive system for the MOE_430 chip and for the developing kidney for the ST_1 chip. The heatmap displays a colour intensity based on the log2 RMA normalised expression values relative to the median value for each row (probe set). Values greater than the median are red, those less than the median are blue, and values close to the median are black. In this example, it can be seen that for probe 1441687_at there is a strong indication that expression is present in the renal vesicle. For more information on GUDMAP protocols to normalise cDNA microarray CHP files, see http://www.gudmap.org/Help/Microarray_Help.html.
Fig. 4.
Fig. 4.
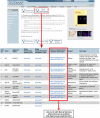
GUDMAP in situ expression entry pages. The components of a GUDMAP database in situ entry page, as shown for GUDMAP:8208, which is for Wnt4 in the metanephros at Theiler stage (TS) 23 (http://www.gudmap.org/gudmap/pages/ish_submission.html?id=GUDMAP%3A8208). The full entry page contains details of the submission information, in situ images, expression mapping (annotations), probe and specimen details. (A) The images section contains thumbnails of the images provided for the entry. These link to the original images so that they can be viewed in detail using the image viewer (see Fig. 5). (B) The expression mapping section shows the anatomical annotations for the entry. In this example, the annotations indicate that Wnt4 is expressed in the comma-shaped body (CSB), with strong expression in the upper limb of the CSB and weak expression in its lower limb. Each annotation can give an indication of expression strength, along with any pattern information and any additional notes. (C) The entry page for the submission also includes full details of the probe used in the assay. This includes the probe type, labelling methods, primer locations and sequence, and has links to the probe details at MGI (where applicable). These details are given to enable replication by the community.
Fig. 5.
Fig. 5.
GUDMAP image galleries and image viewer. (A) Gene expression summaries also link to an image gallery of all the in situ images from all entries for that gene. (B) Shown is a selection from the image gallery for Wnt4. Images are organised into columns by Theiler stage. Next to each image is a link to the individual entry from which the image came. (C) Whether accessing images from a GUDMAP entry page (see Fig. 4) or from the image gallery, all images on the GUDMAP web interface can be viewed in detail using the image viewer by clicking on the image thumbnail. The viewer enables users to zoom in on an image to pick up fine details and view other images from the same entry. Being able to view images easily and in such detail assists in understanding the annotations for a given entry and in understanding the expression of a gene in a given structural component(s).
Fig. 6.
Fig. 6.
GUDMAP transgenic mouse strains. Accessing the transgenic mouse strains generated by GUDMAP is simple. From the GUDMAP home page (www.gudmap.org), click on the ‘Marker Mouse Strains’ button. This takes you to a table of the novel transgenic mouse strains generated by the project. For each strain there are links to both the allele verification and characterisation information. There is also a link to JAX Mice & Services, from where the strains can be ordered.

References

    1. Amberger J., Bocchini C. A., Scott A. F., Hamosh A. (2009). McKusick's Online Mendelian Inheritance in Man (OMIM). Nucleic Acids Res. 37, D793-D796 - PMC - PubMed
    1. Baldock R. A., Bard J. B., Burger A., Burton N., Christiansen J., Feng G., Hill B., Houghton D., Kaufman M., Rao J., et al. (2003). EMAP and EMAGE: a framework for understanding spatially organized data. Neuroinformatics 1, 309-325 - PubMed
    1. Bard J. (2007). Systems developmental biology: the use of ontologies in annotating models and in identifying gene function within and across species. Mamm. Genome 18, 402-411 - PMC - PubMed
    1. Bard J. L., Kaufman M. H., Dubreuil C., Brune R. M., Burger A., Baldock R. A., Davidson D. R. (1998). An internet-accessible database of mouse developmental anatomy based on a systematic nomenclature. Mech. Dev. 74, 111-120 - PubMed
    1. Barrett T., Troup D. B., Wilhite S. E., Ledoux P., Rudnev D., Evangelista C., Kim I. F., Soboleva A., Tomashevsky M., Marshall K. A., et al. (2009). NCBI GEO: archive for high-throughput functional genomic data. Nucleic Acids Res. 37, D885-D890 - PMC - PubMed

Publication types