. 2011 Aug 11;118(6):1632-40.
doi: 10.1182/blood-2010-11-321125. Epub 2011 Jun 7.

Endothelial cell substrate stiffness influences neutrophil transmigration via myosin light chain kinase-dependent cell contraction

Affiliations

Endothelial cell substrate stiffness influences neutrophil transmigration via myosin light chain kinase-dependent cell contraction

Kimberly M Stroka et al. Blood. .

Abstract

A vast amount of work has been dedicated to the effects of shear flow and cytokines on leukocyte transmigration. However, no studies have explored the effects of substrate stiffness on transmigration. Here, we investigated important aspects of endothelial cell contraction-mediated neutrophil transmigration using an in vitro model of the vascular endothelium. We modeled blood vessels of varying mechanical properties using fibronectin-coated polyacrylamide gels of varying physiologic stiffness, plated with human umbilical vein endothelial cell (HUVEC) monolayers, which were activated with tumor necrosis factor-α. Interestingly, neutrophil transmigration increased with increasing substrate stiffness below the endothelium. HUVEC intercellular adhesion molecule-1 expression, stiffness, cytoskeletal arrangement, morphology, and cell-substrate adhesion could not account for the dependence of transmigration on HUVEC substrate stiffness. We also explored the role of cell contraction and observed that large holes formed in endothelium on stiff substrates several minutes after neutrophil transmigration reached a maximum. Further, suppression of contraction through inhibition of myosin light chain kinase normalized the effects of substrate stiffness by reducing transmigration and eliminating hole formation in HUVECs on stiff substrates. These results provide strong evidence that neutrophil transmigration is regulated by myosin light chain kinase-mediated endothelial cell contraction and that this event depends on subendothelial cell matrix stiffness.


Figures
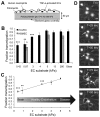
Figure 1
Figure 1
An in vitro neutrophil transmigration assay was used to investigate the effects of HUVEC substrate stiffness on neutrophil transmigration. (A) HUVECs were plated onto fibronectin-coated polyacrylamide gels of various stiffnesses from 0.42 kPa to 280 kPa. After monolayer formation, HUVECs were treated with TNF-α to induce an inflammatory response. Neutrophils were isolated from human blood and plated onto the HUVEC monolayer. (B) The fraction of neutrophils that transmigrated (as described in “Transmigration assays”) was quantified as a function of the stiffness below the HUVECs. Bars represent average fraction of transmigrated cells. Error bars represent SE of 3 to 8 experiments (N = 6, 8, 4, 6, 8, 3, 7, and 3 from 0.42, 0.87, 3, 4, 5, 13, and 280 kPa, and glass [∼ 50 GPa], respectively). (C) Data from panel B, up to 5 kPa, are plotted with a linear fit (r2 = 0.99). (B-C) ***P < .001, **P < .005, or P < .05, using a t test compared with 5 kPa value of same cell type. (D) Shown is an example of a phase-contrast time lapse image sequence of 4 neutrophils, 2 of which transmigrate through the endothelium. Scale bar represents 10 μm and applies to all images. T = 0 is time just before initiation of transmigration in the first cell. White arrows point to the phase-darkened portion of the neutrophil as it transmigrates through the endothelium. At T = 75 seconds, the white arrowhead points to a neutrophil that possibly initiates but does not complete transmigration. In the final frame, the 2 darkened neutrophils are between the endothelium and the gel, whereas the 2 white neutrophils are on top of the endothelium.
Figure 2
Figure 2
Immunostaining indicates no change in ICAM-1 expression with substrate stiffness. ICAM-1 was measured as a function of HUVEC substrate stiffness using a fluorescently tagged antibody to ICAM-1 on nonpermeabilized TNF-α-activated HUVEC monolayers. Fluorescence images were taken over many locations on the nonpermeabilized HUVEC monolayer surface (A), and intensity (in arbitrary units, au) was quantified using ImageJ software (B). Scale bar in panel A is 20 μm and applies to all images. Substrate stiffness is indicated in the upper left corner of each image in panel A. Bars represent average of at least 20 images from each of 2 independent experiments. Error bars represent SE. ANOVA indicates that P > .05 among stiffnesses.
Figure 3
Figure 3
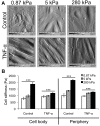
AFM data reveal only a slight increase in TNF-α-activated HUVEC stiffness with substrate stiffness. (A) AFM was used to obtain deflection images for HUVEC monolayers on 0.87-, 5-, and 280-kPa substrates, both under control and TNF-α-treated conditions. Deflection images are 90 μm × 90 μm. (B) AFM was also used to quantify the Young modulus (“stiffness”) of HUVEC monolayers as a function of substrate stiffness in the control (no TNF-α) and after TNF-α treatment. The stiffness of the “cell body” region (raised portion of the cell) and periphery (flattened region just around the raised portion) were quantified separately. Bars represent average stiffness from N force curves from 3 independent experiments. Error bars represent SE. N = 47, 50, and 89 on control monolayers on 0.87, 5, and 280 kPa, respectively, at the cell body. N = 381, 351, and 334 on control monolayers on 0.87, 5, and 280 kPa, respectively, at the periphery. N = 96, 121, and 160 on TNF-α-activated monolayers on 0.87, 5, and 280 kPa, respectively, at the cell body. N = 396, 357, and 399 on TNF-α-activated monolayers on 0.87, 5, and 280 kPa, respectively, at the periphery. ***P < .001 (using ANOVA). On 280 kPa, P < .001 between control and TNF-α at both cell body and periphery using Student t test.
Figure 4
Figure 4
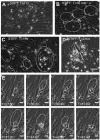
Neutrophil transmigration on stiff substrates causes injury to the monolayer. Shown are representative phase-contrast images of the HUVEC monolayer after neutrophil transmigration on (A) a soft (0.87-kPa) substrate and (B-C) stiff (280-kPa) substrates. Time after plating neutrophils onto the HUVEC monolayers (T) is shown at the top of each image. Large holes commonly form in monolayers on stiff substrates after transmigration and are outlined in panels B and C by white dotted lines. (D) Also shown is a phase-contrast image of a monolayer on a 280-kPa substrate at approximately 2 hours after plating neutrophils. Significant neutrophil accumulation in the area of the hole has occurred. Scale bar in panel D is 50 μm and applies to images in panels A-D. (E) Shown is a time sequence of a hole forming and then healing on a 5-kPa substrate. Time after plating neutrophils is indicated at the bottom of each image. The scale bars on all images in panel E are 20 μm.
Figure 5
Figure 5
EC hole formation begins when neutrophil transmigration has reached a maximum. (A) Fraction of neutrophils that have transmigrated (primary vertical axis) as a function of time after addition of neutrophils is shown for varying substrates (0.87, 5, 280 kPa). Also plotted is the number of holes per area (secondary vertical axis) as a function of time after addition of neutrophils, for varying substrates and number of neutrophils plated. (B) Data from panel A at T = 45 minutes are highlighted. Shown is the number of holes per area on each of the substrates, with varying numbers of neutrophils. (C) The area of holes at T = 45 minutes is quantified for varying substrate stiffness and number of neutrophils plated. Bars represent average. Error bars represent SE. *P < .05 (using ANOVA). ***P < .001 (using ANOVA).
Figure 6
Figure 6
MLCK mediates substrate stiffness-dependent neutrophil transmigration. (A) TNF-α–activated HUVEC monolayers were pretreated with appropriate control (DMSO or IgG antibody), cytoB, or VE-cadherin antibody (VEcad Ab) for one hour. Neutrophils were plated onto the HUVECs, and the fraction of transmigration was quantified on soft (0.87 kPa) and stiff (280 kPa) substrates. (B) TNF-α–activated HUVEC monolayers were pretreated with DMSO, blebbistatin, or ML-7. Neutrophils were plated onto the HUVECs, and the fraction of transmigration was quantified on soft (0.87 kPa), intermediate (5 kPa), and stiff (280 kPa) substrates. Also shown is the fraction of transmigration for ML-7–treated neutrophils through TNF-α–treated monolayers. (A-B) Bars represent average fraction of transmigrated cells. Error bars represent SE from at least 3 independent experiments. (A) *P < .05 with IgG antibody control using Student t test. (B) *P < .05, **P < .01 between treated monolayers and DMSO control using Student t test. (C) Schematic illustrating a possible mechanism for how pretreatment of HUVEC monolayers with ML-7 normalizes the effects of substrate stiffness in neutrophil transmigration. Before ML-7 treatment (left), neutrophil adherence to the endothelium induces a signaling cascade, which activates MLCK and results in endothelial cell contraction (black arrows) and gap formation. Because the cells can presumably exert more traction on a stiffer substrate, they are capable of creating larger gaps on the stiff substrate, ultimately allowing more neutrophils to transmigrate through. Treatment of the endothelium with ML-7 causes inhibition of contraction on the stiff substrate. The soft substrate is unaffected, possibly because contraction was already suppressed to some degree, and ML-7 treatment did not produce further effects.
Figure 7
Figure 7
Signaling cascade initiated by neutrophil adhesion to ECs is affected by substrate mechanical properties. This flow chart indicates how our results fit into the signaling cascade initiated by neutrophil adhesion to ICAM-1 on the endothelium. **Cellular components were measured using various microscopic techniques. Components outlined with dotted lines were varied experimentally.

References

    1. Stroka KM, Aranda-Espinoza H. A biophysical view of the interplay between mechanical forces and signaling pathways during transendothelial cell migration. FEBS J. 2010;277(5):1145–1158. - PubMed
    1. Blacher J, Asmar R, Djane S, London GM, Safar ME. Aortic pulse wave velocity as a marker of cardiovascular risk in hypertensive patients. Hypertension. 1999;33(5):1111–1117. - PubMed
    1. Boutouyrie P, Tropeano AI, Asmar R, et al. Aortic stiffness is an independent predictor of primary coronary events in hypertensive patients: a longitudinal study. Hypertension. 2002;39(1):10–15. - PubMed
    1. Kothapalli D, Liu S, Byfield FJ, et al. Apolipoprotein E controls matrix protein synthesis and arterial stiffness.. Poster presented at the American Society of Cell Biology Annual Meeting; December 14, 2010; Philadelphia, PA.
    1. Zieman SJ, Melenovsky V, Kass DA. Mechanisms, pathophysiology, and therapy of arterial stiffness. Arterioscler Thromb Vasc Biol. 2005;25(5):932–943. - PubMed

Publication types

MeSH terms