. 2011 Jul 29;286(30):26743-53.
doi: 10.1074/jbc.M111.233700. Epub 2011 Jun 7.

The interaction between nesprins and sun proteins at the nuclear envelope is critical for force transmission between the nucleus and cytoskeleton

Affiliations

The interaction between nesprins and sun proteins at the nuclear envelope is critical for force transmission between the nucleus and cytoskeleton

Maria L Lombardi et al. J Biol Chem. .

Abstract

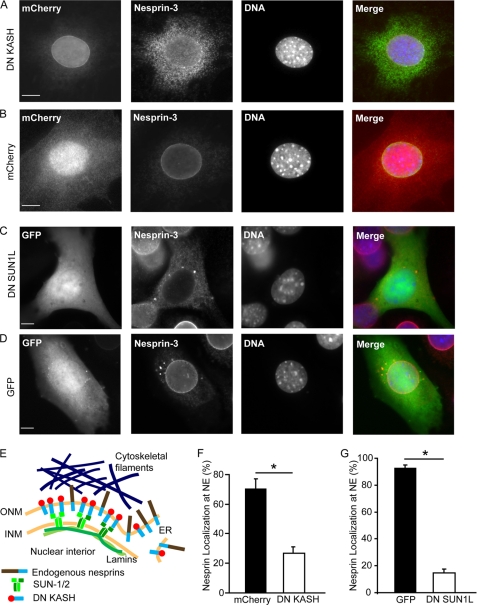
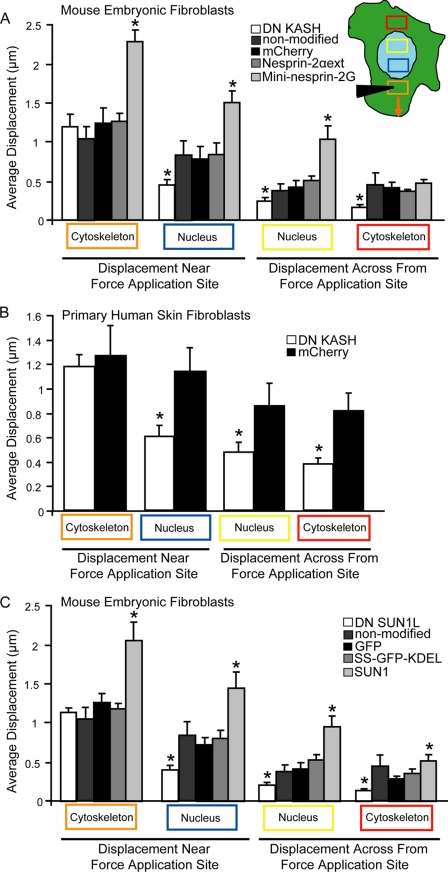
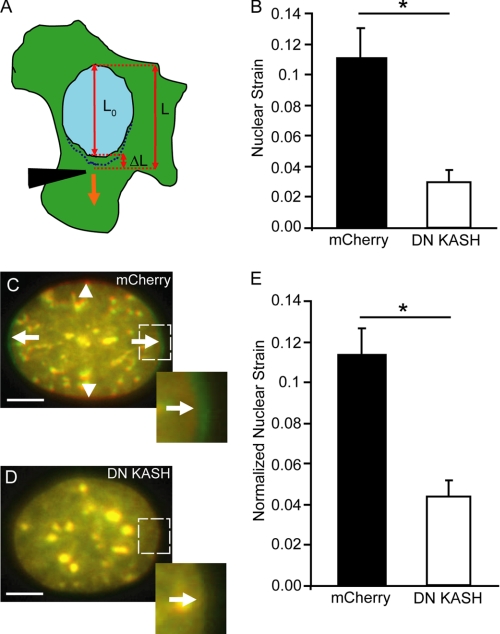
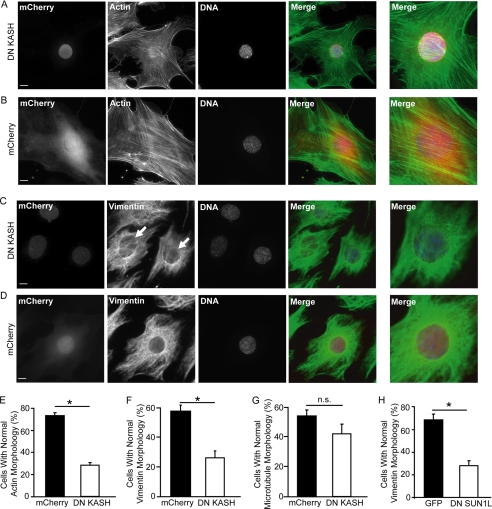
Maintaining physical connections between the nucleus and the cytoskeleton is important for many cellular processes that require coordinated movement and positioning of the nucleus. Nucleo-cytoskeletal coupling is also necessary to transmit extracellular mechanical stimuli across the cytoskeleton to the nucleus, where they may initiate mechanotransduction events. The LINC (Linker of Nucleoskeleton and Cytoskeleton) complex, formed by the interaction of nesprins and SUN proteins at the nuclear envelope, can bind to nuclear and cytoskeletal elements; however, its functional importance in transmitting intracellular forces has never been directly tested. This question is particularly relevant since recent findings have linked nesprin mutations to muscular dystrophy and dilated cardiomyopathy. Using biophysical assays to assess intracellular force transmission and associated cellular functions, we identified the LINC complex as a critical component for nucleo-cytoskeletal force transmission. Disruption of the LINC complex caused impaired propagation of intracellular forces and disturbed organization of the perinuclear actin and intermediate filament networks. Although mechanically induced activation of mechanosensitive genes was normal (suggesting that nuclear deformation is not required for mechanotransduction signaling) cells exhibited other severe functional defects after LINC complex disruption; nuclear positioning and cell polarization were impaired in migrating cells and in cells plated on micropatterned substrates, and cell migration speed and persistence time were significantly reduced. Taken together, our findings suggest that the LINC complex is critical for nucleo-cytoskeletal force transmission and that LINC complex disruption can result in defects in cellular structure and function that may contribute to the development of muscular dystrophies and cardiomyopathies.


Figures

FIGURE 1.
FIGURE 1.
Dominant negative nesprin and SUN constructs displace endogenous nesprins from the nuclear envelope. A and B, immunofluorescence images of MEFs stably expressing DN KASH (A) or mCherry (B). Cells were stained for nesprin-3 (second panel) and DNA (Hoechst 33342, third panel). C and D, immunofluorescence images of MEFs transiently expressing DN SUN1L (C) or GFP alone (D). Cells were stained for nesprin-3 (second panel) and DNA (third panel). Localization of DN SUN1L to the nuclear envelope and endoplasmic reticulum is shown in supplemental Fig. S1. Scale bars, 10 μm. E, scheme of LINC complex disruption by DN KASH and the displacement of endogenous nesprins from the nuclear envelope to the ER. INM, inner nuclear membrane; ONM, outer nuclear membrane. F and G, percentage of cells with normal nuclear envelope (NE) localization of endogenous nesprin-3 in DN KASH (F) and DN SUN1L (G)-expressing cells. More than 100 cells were analyzed for each sample; data are represented as mean ± S.E.; *, p < 0.05.
FIGURE 2.
FIGURE 2.
Microneedle manipulation assay to measure intracellular force transmission. Phase contrast (A and B) and fluorescence (C and D) images of a fibroblast labeled with Hoechst 33342 nuclear stain (blue) and MitroTracker Green mitochondrial stain (green). A microneedle was inserted into the cytoskeleton at a defined distance from the nucleus (A and C) and subsequently moved toward the cell periphery (B and D). Cytoskeletal and nuclear displacements were quantified by tracking the fluorescently labeled nucleus and mitochondria using a custom-written cross-correlation algorithm. E, displacement map of the final cytoskeletal (green) deformations computed from fluorescence image series; arrow length is magnified by 2× for better visibility. Scale bars, 10 μm. F and G, to validate that mitochondria was a suitable cytoskeletal marker, microneedle manipulation was conducted on MEFs transfected with GFP- or mCherry actin (F) and GFP-vimentin (G) and fluorescently labeled with Mitotracker Green or Red. Cytoskeletal displacement maps were calculated independently from the fluorescent signal of the mitochondria and the actin (F) or vimentin (G) cytoskeleton. The average absolute displacement was computed for four distinct cytoskeletal regions at increasing distances away from the strain application site. The slope and R-squared values were computed from the linear regression between the measurements obtained from mitochondria and from actin (F) or vimentin (G), respectively. For actin, the slope was 0.99 and the R2 value was 0.986; for vimentin, the slope was 1.04 and the R2 value was 0.971, confirming that mitochondrial displacements serve as reliable indicators for cytoskeletal deformations. See supplemental Movie S1.
FIGURE 3.
FIGURE 3.
LINC complex disruption impairs intracellular force transmission. A–C, induced cytoskeletal and nuclear displacements during microneedle manipulation, measured in the areas corresponding to the colored rectangles (inset in A). The orange rectangle is the strain application site. Despite similar strain application in the cytoskeleton (orange box), induced nuclear and cytoskeletal displacements (blue, yellow, and red boxes) were significantly smaller in the DN KASH expressing MEFs (A) and human skin fibroblasts (B) and DN SUN1L expressing MEFs (C), compared with non-modified cells and corresponding mCherry or GFP controls. As additional controls, we included experiments with cells expressing nesprin-2α with a modified KASH domain (nesprin-2αext)(A) that cannot bind to SUN proteins (12) and with cells expressing SS-GFP-KDEL that is targeted to the perinuclear space and endoplasmic reticulum, similar to the DN SUNL1 construct (C). We also performed experiments on cells ectopically expressing mini-nesprin-2G (A), which had been previously shown to rescue nuclear movement in cells after nesprin-depletion (14), and in cells expressing wild-type SUN1 (C). In both cases, we observed a marked gain-of-function. For each sample, 15 to 20 cells were analyzed; data are represented as mean ± S.E.; *, p < 0.05. Asterisks shown are relative to corresponding mCherry or GFP controls. Data for non-modified cells from (A) are replotted in (C) for reference. See supplemental Movies S2 and S3.
FIGURE 4.
FIGURE 4.
Strain-induced nuclear deformation is reduced in LINC-disrupted cells. A, computation of nuclear strain induced by microneedle manipulation as shown in B. Nuclear strain was calculated by dividing the nuclear elongation (ΔL = LL0) by the initial length (L0). L is the final length of the nucleus at the end of strain application. B, DN KASH expressing MEFs show a significant decrease in nuclear strain compared with mCherry alone expressing cells. C–E, nuclear deformation in response to substrate strain application. Overlay of representative pseudo-colored images of fluorescently labeled nuclei of MEFs expressing mCherry (C) or DN KASH (D) before strain (red) and during 20% uniaxial substrate strain application (green). Arrows indicate the nuclear elongation in strain direction; arrowheads indicate the narrowing of the nucleus in the perpendicular direction (C). Inset, detail of nuclear deformation. E, normalized nuclear strain revealed that MEFs expressing DN KASH had a significant decrease in nuclear deformation. See supplemental Movies S4 and S5. Scale bars, 5 μm. For each sample, 15–20 cells were analyzed; data are represented as mean ± S.E.; *, p < 0.05.
FIGURE 5.
FIGURE 5.
LINC complex disruption alters cytoskeletal organization. A–D, immunofluorescence analysis of MEFs expressing DN KASH (A and C) and mCherry control (B and D). Cells were stained for F-actin (A and B, second panel), vimentin (C and D; second panel), and DNA (A–D, third panel). Last panel, close-up of perinuclear area. Arrows indicate area with disturbed perinuclear vimentin network organization (C). Scale bar, 10 μm. E–H, percentage of cells with normal organization of the perinuclear actin (E), vimentin (F, H), or microtubule (G) network in MEFs expressing DN KASH (E–G) or DN SUN1L (H). More than 100 cells were analyzed for each sample; data are represented as mean ± S.E.; *, p < 0.05. See also supplemental Fig. S4.
FIGURE 6.
FIGURE 6.
LINC complex disruption causes impaired cell migration and polarization. A–C, in vitro scratch wound assay. A, phase contrast images of mCherry and DN KASH expressing MEFs taken at 0 or 3 h post-wound. Scale bar, 80 μm. B, open wound area remaining after 3 h; n = 27 wounds. C, percentage of cells at wound edge with centrosome orientation toward the wound (see scheme) at 0 and 3 h post-wound; n = 127 for mCherry and n = 97 for DN KASH. D–F, cell polarization after culture on micropatterned substrates. D, first panel, red signal, revealing fluorescently labeled fibronectin-coated crossbow pattern and mCherry constructs. Second panel, centrosome labeled by γ-tubulin staining. Third panel, DNA stain. Last panel, merged image; arrows indicate centrosome position. Scale bar, 5 μm. E, percentage of cells with correct polarization. Cells were scored as polarized when the centrosome was located in the forward facing sector (inset, green segment); n = 33 for mCherry and n = 32 for DN KASH. F, average distance of nucleus (Nuc) and centrosome (Cen) from the crossbow pattern center. Control cells display rearward nuclear position and central centrosome position (14); n = 33 for mCherry and n = 32 for DN KASH. G–J, single cell migration analysis of MEFs expressing DN KASH or mCherry. G and H, Rose plots, showing the total distance traveled and the directionality of movement for five representative cells for each cell type during a 6-h period. Average cell speed (I) and persistence time (J) were computed from individual cell traces; n = 138 for mCherry and n = 136 for DN KASH. For each experiment, data are represented as mean ± S.E.; *, p < 0.05.

References

    1. Crisp M., Liu Q., Roux K., Rattner J. B., Shanahan C., Burke B., Stahl P. D., Hodzic D. (2006) J. Cell Biol. 172, 41–53 - PMC - PubMed
    1. Haque F., Lloyd D. J., Smallwood D. T., Dent C. L., Shanahan C. M., Fry A. M., Trembath R. C., Shackleton S. (2006) Mol. Cell. Biol. 26, 3738–3751 - PMC - PubMed
    1. Padmakumar V. C., Libotte T., Lu W., Zaim H., Abraham S., Noegel A. A., Gotzmann J., Foisner R., Karakesisoglou I. (2005) J. Cell Sci. 118, 3419–3430 - PubMed
    1. Padmakumar V. C., Abraham S., Braune S., Noegel A. A., Tunggal B., Karakesisoglou I., Korenbaum E. (2004) Exp. Cell Res. 295, 330–339 - PubMed
    1. Zhen Y. Y., Libotte T., Munck M., Noegel A. A., Korenbaum E. (2002) J. Cell Sci. 115, 3207–3222 - PubMed

Publication types